
 Minter
 Quack AI
 Pearl
Pearl Monero
 The Sandbox
 Pons
Pons Bittensor
- STX coin is currently moving in a triangle pattern, with an increase of 3.66% in today’s market session.
- The total number of STX coins till today is 139,499,035 STX.
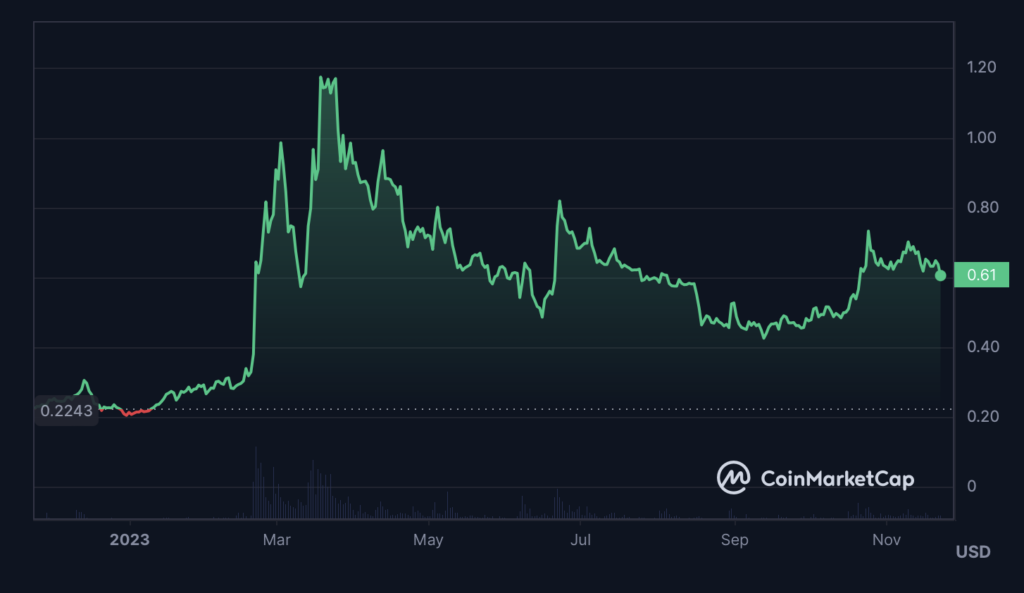
Stacks (STX) serves as the indigenous token for the Stacks blockchain, functioning as a layer-one blockchain constructed atop the Bitcoin blockchain. The Stacks blockchain is formulated to empower developers in crafting decentralized applications (dApps) with smart contracts.
The STX token is developed using the clarity smart contract language, designed specifically for security and adaptability purposes.
Financial Data of STX Coin
The STX coin is trading at $0.60, which rose by 3.66% in the last 24 hours. The 52-week high and low of the Stacks are $0.20 and $1.30 respectively.
The total trading volume of STX is $103 Million and it increased over 47% in the last 24 hours as per CoinGlass. The increasing volume suggests the presence of buyers in the market.
The long/short position for the last 24 hours for the Stacks coin is 0.9088 and the open interest is $34.9 Million. The buyers are active in the market.
Stacks Technical Analysis
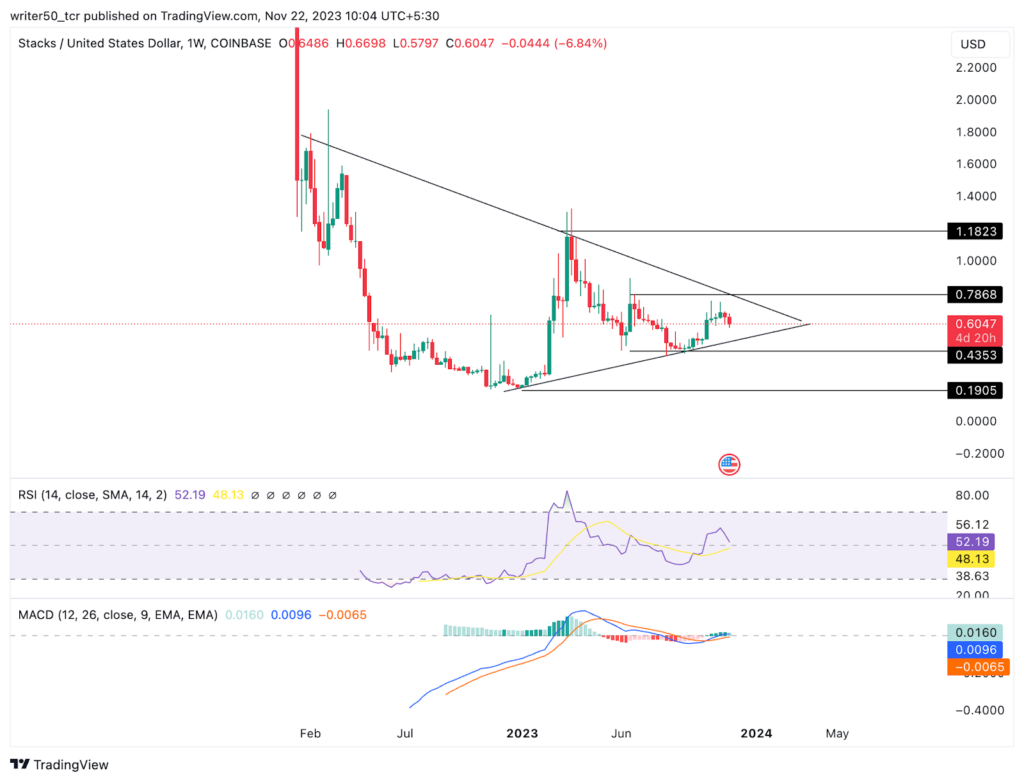
The Stacks coin is trading in between the triangle pattern. After hitting the high, the price fell by nearly 92% and found support at the $0.19 level.
The overall structure of the coin in the weekly timeframe indicates an uptrend momentum and the price will show further gains if it breaks above the immediate resistance level.
Technical Indicators:
The STX coin’s MACD line trades above the signal line, accompanied by the formation of a green histogram, this is a positive signal and the price might see higher levels in future.
Furthermore, the RSI line is presently positioned at the 52 level, with the SMA line close to the 45 level. This configuration, with the RSI above the SMA line, is regarded as a positive signal, suggesting an expected bullish trend in the upcoming days.
Conclusion
In conclusion, the STX coin volume is rising, representing the presence of buyers. The coin is trading inside the positive pattern. The overall structure is positive and the indicators are giving a positive recommendation, if the price breaks above the resistance level of $0.6 a further upward move can be seen in the upcoming days.
Technical Levels
- Support Levels: $0.4 and $0.19
- Resistance Levels: $0.7 and $1.18
Disclaimer
The views and opinions of the author, or anyone else in this article, are for informational purposes only. They do not offer financial, investment, or other advice. Investing or trading crypto assets involves the risk of financial loss.




