
 Dacity Coin
 streamoors
 Celestia
 Injective
 Quantus
 Pudgy Penguins
 Pearl
Pearl
- The SHIB memecoin price consolidates between the $0.000028 and $0.000020 levels.
- An increase of 1.20% has been observed in the Shiba Inu price during the intraday trading session.
- The crypto outperforms Dogecoin (DOGE) and XRP (XRP) prices in the daily session.
Created in August 2020, Shiba Inu (SHIB) is a community-driven dog-themed memecoin on the Ethereum blockchain. The memecoin has become a worldwide phenomenon, and the native token SHIB is accepted as a form of payment in various locations.
For the last three months, SHIB crypto has experienced massive growth in price. The memecoin has shown a 440% bullish rally and over 150% positive returns to date. However, the Shiba Inu price had some bearish remarks in April 2024, but a positive uprise seems to be happening in the current month.
Will Bulls Resurge After Consolidation Period? SHIB Performance
The Shiba Inu price has shown enormous strength in February 2024. The crypto formed impulsive bullish candles from the $0.000009 level on Feb 26, 2024. Consequently, the price reflected an over 440% positive rally to the $0.000047 resistance level. Currently, the crypto consolidates between the $0.000028 and $0.000020 levels.
In terms of market cap, the SHIB token has placed itself amongst the top 15 most dominant cryptocurrencies globally. The current market capitalization stands at $13.86 Billion, with 589 Trillion SHIB tokens circulating supply. Conversely, the community behind this memecoin is 83% bullish today.
Price Volatility & Social Dominance Analysis
In early March 2024, the Shiba Inu social buzz reached over 3.5% across the crypto world. During that time, the price volatility also increased over 0.16, and the price surged over $0.000036. This reflects the importance of social sentiments about crypto.
However, the dominance has been fading away since then, along with the price, showing the decreasing interest of users.
Technical Analysis of the Shiba Inu (SHIB/USD)
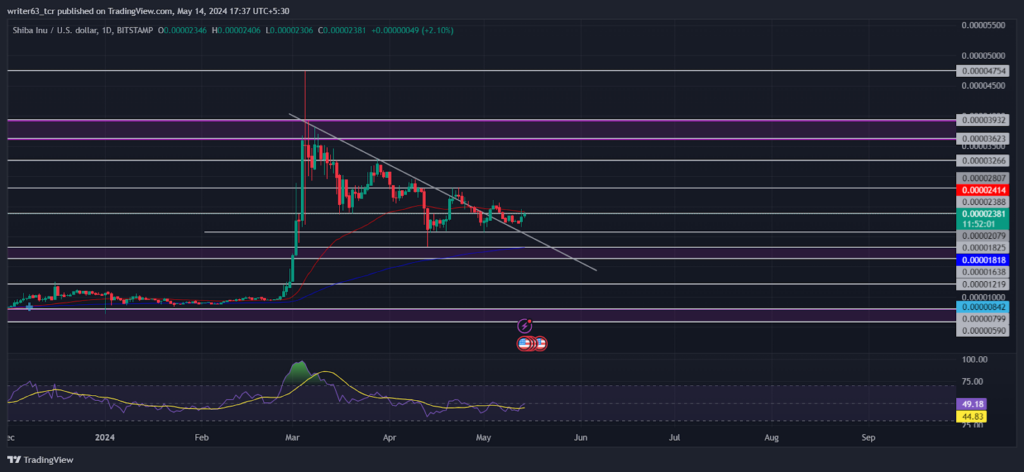
The sideways short-term outlook lies between the key exponential moving averages, indicating uncertainty in direction. The current price seems to be rebounding the 50-day EMA, reflecting the possibility of the bullish trend continuation.
SHIB price has given a breakout from a trendline, which has formed above, since the $0.000039 level. The buyers have shown their presence at the $0.000018 level. They surged the crypto price over 50% from that specific level.
Afterward, the price entered between the consolidation ranges of $0.000028 and $0.000020. Conversely, the price may move in accordance with these given levels.
The relative strength index (RSI) is showing an internal bullish divergence in the price momentum. This indicates a potential shift in current market strength. The RSI line is moving at 51.42 above the signal line.
Summary
The bullish correction period in Shiba Inu price seems to have ended in the current phase. The crypto price is trading in a consolidation period. However, a breakout of the above-forming trendline has happened in recent sessions. This can intrigue many traders in the room.
Technical Levels
At the time of writing, the immediate support for the SHIIB price was $0.000018, and the $0.000028 level was the next resistance. If the price breaks any of these levels, the price will move in that direction.
Disclaimer
The views and opinions stated by the author or any people named in this article are for informational purposes only. They do not establish financial, investment, or any other advice. Investing in or trading crypto or stock comes with a risk of financial loss.




