
 Celestia
 Quantus
 Starknet
 Pearl
Pearl LayerZero
 Lighter
 Bitcoin
- The ALICE token price has advanced by 80% in just the last three days.
- In the last 30 days, MyNeighborAlice crypto has traded in green for the previous 15 days.
My Neighbor Alice is a blockchain game where players manage NFTs in a virtual world. They use the $ALICE tokens to buy/sell NFTs, craft special ones, and vote on game changes. The game also has another currency, Björn.
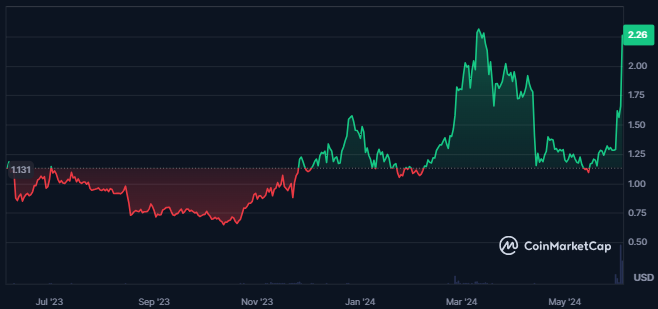
There has been very little change in the value of the crypto’s traded volume within the last 24 hours from the time of writing. It further results in a traded value of $463.309M.
At the time of writing, MyNeighborAlice crypto’s market cap ranking is #353 as per CoinMarketCap, and it has a fully diluted market of $225.976 million. Also, the value of the traded volume for the crypto has exceeded the market cap value.
The following phenomenon has resulted in a huge liquidity followed by a volume/market cap ratio of 297.78%. The circulating supply of the crypto is 67.9% of the maximum supply of the crypto.
MyNeighborAlice Crypto Derivatives Data Analysis
The derivatives volume chart of the MyNeighborAlice crypto shows a strong surge in the trading volume and the trading price in just the last few days.
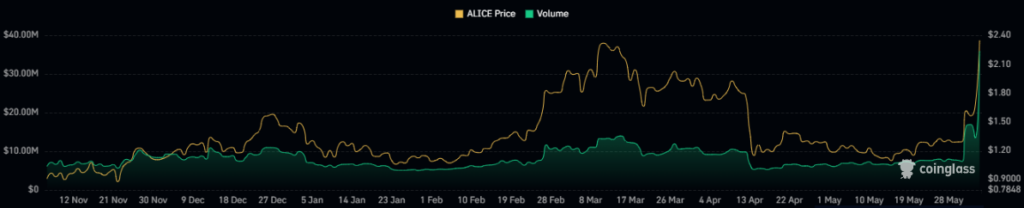
There has been a 31% surge in the derivatives trading volume of the MyNeighborAlice crypto in the last 24 hours. It has resulted in a traded value of $874.75M while the crypto’s open interest has declined by 11.7%.
The MyNeighborAlice crypto has witnessed higher long liquidation in the last 24 hours, but the short liquidation for the crypto has also been close. As a result, the long liquidation of the crypto is $373.11K, and its short liquidation is $338.69K.
ALICE Crypto Technical Analysis
The ALICE crypto price has formed solid bullish candles on the daily chart. This behavior shows the buyers’ strong dominance in the crypto’s trading price.
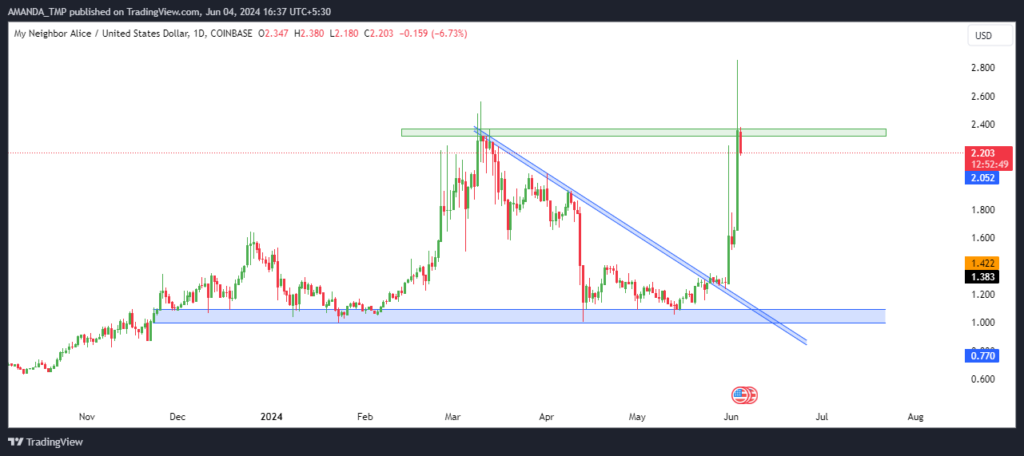
The ALICE crypto price was trading in a strong downtrend, followed by the formation of the lower low swing on the chart. This behavior of the crypto further led to the formation of the descending triangle pattern.
The crypto price further led to a breakout and triggered a surge of 85%.
ALICE crypto’s price has hit strong resistance levels, and if it breaks and sustains above the same, a further surge in the trading price of the crypto might be possible.
ALICE/USD Chart by TradingView on
The trading price of the ALICE crypto has broken above the Bollinger band on the daily chart. It was trading above the 50-day and the 200-day EMAs. Moreover, the EMAs on the chart are trading in a golden crossover.
The histograms formed on the MACD chart of the ALICE crypto are strongly bullish, and the MACD and the signal line are trading in a golden crossover. MACD metrics have also advanced to a bullish trajectory.
The RSI has hit the overbought zone and is trading at the 76 level at press time. It shows the strength in the ALICE crypto’s momentum.
Summary
MyNeighborAlice (ALICE) token price has surged 80% in the past three days, trading green for 15 of the last 30 days.
Solid bullish technical indicators, high liquidity, and increased derivatives trading volume suggest the potential for further price surges. The ALICE token price is currently trading above key resistance levels, signaling strong buyer dominance.
The support levels for the ALICE crypto are $1.005 and $1.50, while the resistance levels for the crypto are $2.80 and $3.30.
Disclaimer
This article is for informational purposes only and does not provide any financial, investment, or other advice. The author or any people mentioned in this article are not responsible for any financial loss that may occur from investing in or trading. Please do your research before making any financial decisions.




