
 Bitcoin
 Aerodrome Finance
 Zerebro
 Starknet
 Zama
Zama Pearl
Pearl ZKsync
- In the last 30 days, the BRETT price has traded in green for 16 days.
- The BRETT token has recorded A higher short liquidation in the last 24 hours.
Brett token has a strong market presence with a market cap dominance of 0.05%. Its market cap at press time was $1.383B, ranking 61st in the global crypto market.
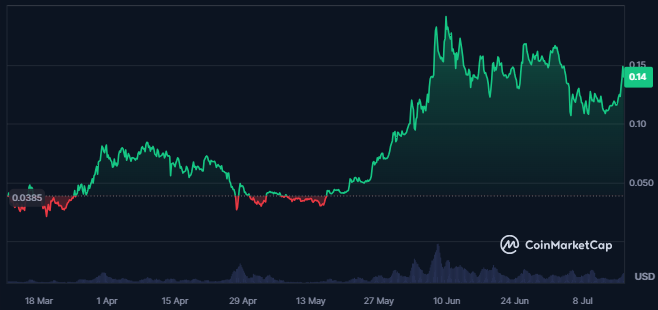
BRETT token’s market has advanced by 12.6% in the last 24 hours. The value of the traded volume for the token has also advanced by 110%.
Those price metrics of the token show a strong surge in the demand for the token. Moreover, the value of the traded volume for the token is $58.396M, which is 3.93% of its market cap. It shows good liquidity in the token price, making buying and selling the token easier.
The token has 99.1% of its maximum supply circulating in the market at the time of writing. It is similar to the token’s total supply and circulating supply. The maximum supply of the token is set at 10.0 billion BRETT.
Brett Token Derivatives Data Analysis
The open interest of the Brett token has advanced by 12% in the last 24 hours. It showed an advance in the token’s open positions and an increased number of traders in the token.

The open interest chart of Brett token shows consistent advances over the last few days. This was followed by a surge in the volume of derivatives trading, which witnessed an advance of 120% in the last 24 hours.
Also, a short liquidation worth $11.01K was recorded in the last 24 hours against the long liquidation worth $1.38K. It indicated bulls’ dominance over the price in the previous 24 hours.
BRETT Technical Analysis
Following the last five months, the trading price of the BRETT token witnessed strong profit booking. That led to a decline of 45% in the trading price from the swing high of $0.19550.
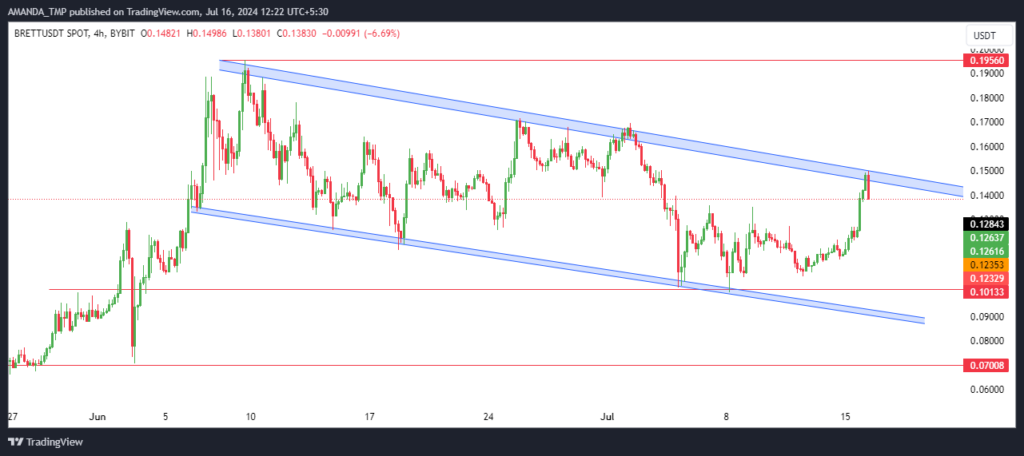
The described decline in BRETT token price has led to the formation of a falling wedge pattern on the charts.
Additionally, after hitting the lower band, the token’s price advanced to a higher band, following solid momentum and volume.
If the token’s price breaks further above the wedge pattern and is sustained above it, we might see a strong uptrend in the token price.
BRETT/USDT Chart by TradingView
The token’s price has advanced above the 50-day and the 200-day EMAs on the token’s 4H chart. It shows a bullish outlook on the token’s price, and the supertrend on the charts also gives a strong bullish signal.
The MACD is also bullish, as the MACD signal has advanced to the bullish trajectory, and the histograms formed on the chart are also strongly bullish.
The RSI has hit the overbought zone and has advanced above the 14-day SMA, followed by a breakout above the 50-level. The RSI at press time was trading at a level of 64.50.
Brett token Indicates a Bullish outlook
The Brett token showed a strong bullish outlook with a significant surge in trading volume and market cap.
The formation of a falling wedge pattern and recent technical indicators, including bullish MACD and RSI, suggested a potential breakout. Increased open interest and short liquidation highlighted growing investor interest and bullish momentum.
The support levels for the BRETT token price are $0.0700 and $0.1050. Additionally, the resistance levels for the token are $0.1670 and $0.1950.
Disclaimer
This article is for informational purposes only and does not provide any financial, investment, or other advice. The author or any people mentioned in this article are not responsible for any financial loss that may occur from investing in or trading. Please do your research before making any financial decisions.




