
 Zerebro
 Bitcoin
 Aerodrome Finance
 ZKsync
 Pearl
Pearl Pudgy Penguins
 Bitway
- In the last 1 year, the Kaspa token price outperformed 83% of the top 100 crypto assets.
- The annual inflation rate of the KAS token was certainly high.
Kaspa token had a very strong market presence, followed by a market cap dominance of 0.21%. It also was the 21st largest token in the global crypto market and had a market cap value of $4.985B.
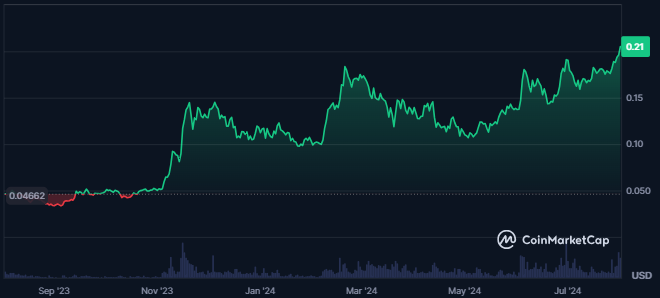
The token’s circulating and total supply were the same, resulting in 24.338B KAS. This further resulted in a fully diluted market of $4.986B, slightly higher than the spot market cap. Additionally, the supply inflation of the token was very high, resulting in 19.38%.
A decline of 4.3% in the value of the traded volume of the token was recorded. This further resulted in a traded value of $149.186M. Also, the KAS token price was highly volatile, resulting in 5.11%.
The token’s sentiment was bullish, while the fear and greed index was neutral at press time. From the all-time low price of $0.0001699, the token price had advanced by 121000%. It had 400K holding addresses, and the top 10 holders held 15.43% of the total supply.
Kaspa Token Derivatives Data Analysis
The open interest of the Kaspa has slightly advanced by 3%. A value of $107.47M followed this, and the long/short ratio of the token was 0.9467.

A surge of 27% in the derivatives traded volume was also recorded, which showed a rise in traders’ interest in the token. The derivatives volume chart further showed a huge surge in the last few days.
While the overall trend of the token price was bullish, higher short liquidations were recorded. This resulted in $43.33K, against which the longs worth $95.46K were liquidated. This showed uncertainty in the price over the last 24 hours.
KAS Token Technical Analysis
The KAS crypto price has recently surpassed its most recent swing high and continues climbing to higher levels.
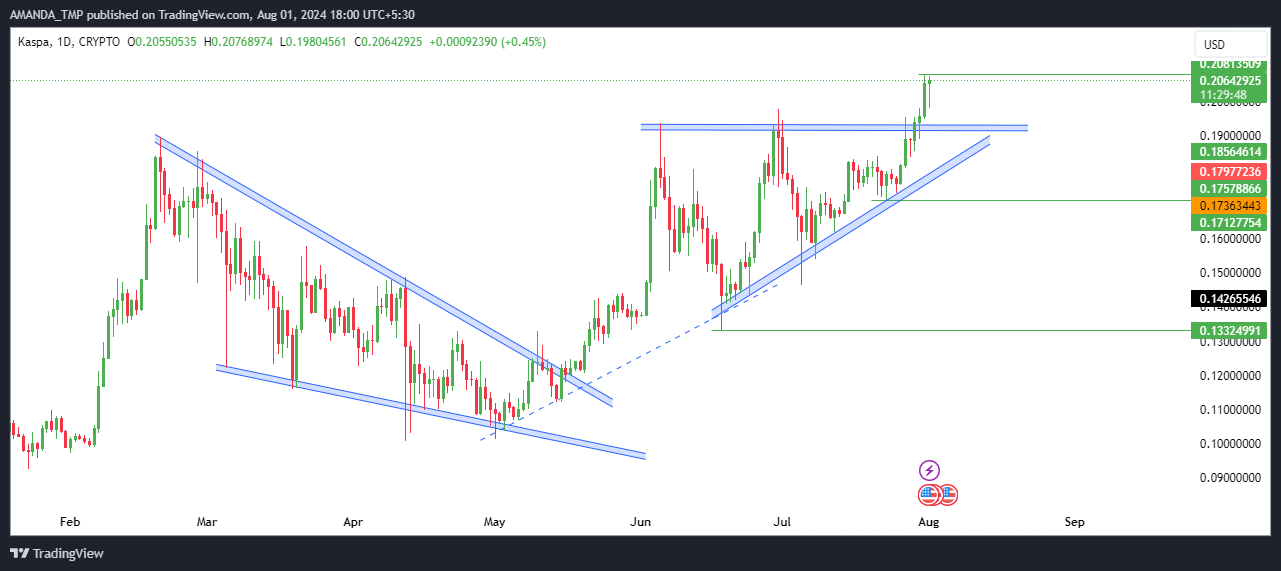
KAS Token Daily Price Chart | Source: TradingView
After experiencing a consistent decline over two months, KAS has broken above the falling wedge pattern. A significant surge in trading volume has accompanied this breakout.
This increase in volume signifies strength in the cryptocurrency’s trend. Consequently, the price has advanced by 20% from the breakout level.
Additionally, the candlesticks formed on the chart support a bullish sentiment, reinforcing the positive outlook for KAS.
KAS Token Technical Indicator Overview
The KAS crypto has been trading in a golden cross pattern, with the 50-day and 200-day EMAs indicating a strong, long-term uptrend. This bullish trend has been sustained for over a year.
KAS/USD Chart by TradingView.com
The crypto price traded above these EMAs on the daily chart reinforcing the positive market sentiment.
The MACD indicator also supported this bullish momentum, as both the MACD line and the signal line were in a bullish trajectory. A golden cross accompanied it; the histograms further supported the buying sentiment.
Moreover, the RSI is trading at 73, having broken above the 14-day SMA. This indicated a robust uptrend in the KAS cryptocurrency’s trading price, suggesting continued upward momentum.
The support levels for the token are $0.1330 and $0.17570, followed by the resistances of $0.250 and $0.30.
Disclaimer
This article is for informational purposes only and does not provide any financial, investment, or other advice. The author or any people mentioned in this article are not responsible for any financial loss that may occur from investing in or trading. Please do your research before making any financial decisions.




