
 Zerebro
 Bitcoin
 Aerodrome Finance
 ZKsync
 Pearl
Pearl Pudgy Penguins
 Bitway
- The BEAM price had advanced by 215% in the last 1 year.
- The token certainly had a lower liquidity in its price at press time.
As the Beam (BEAM ) crypto price traded in green for the last 1 year, the overall performance of the token was positive. The Total Value Locked for the BEAM crypto has declined to $3.03M over the last few weeks. It raised $2.0M, and the token’s market cap was worth $770.903M.
BEAM was the 78th largest cryptocurrency in the global crypto market when writing. It had a market cap dominance of 0.04%.
The token’s price was highly volatile, resulting in a volatility of 12.58%. This might lead to uncertain spikes in the token price in the future.
The fear and greed index was at 34. It showed fear among the token investors, influencing the BEAM price prediction. The token’s sentiment was neutral, and the market cap advanced by 5.6% in the last 24 hours from press time.
A surge of 32% in the BEAM price was recorded in the last 24 hours. This resulted in a value of $15.188M, which was just 1.9% of the token’s market cap.
More Positions In BEAM Token Derivatives, What’s Cooking Inside?
The BEAM token’s derivatives data witnessed an advance of 13.5% in the last 24 hours from the press time. This showed a rise in the number of open positions in the token.
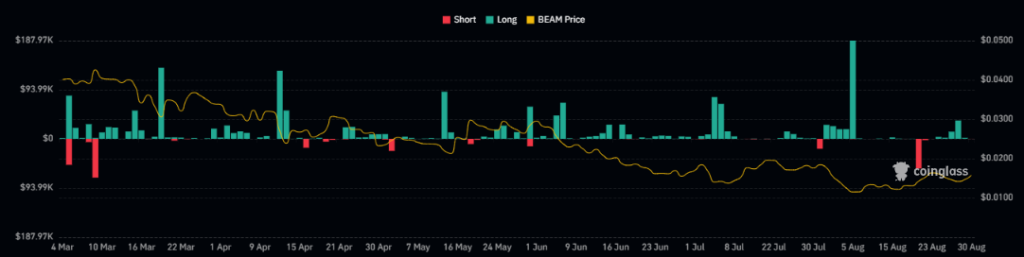
The BEAM token showed higher long liquidations over the last 24 hours, valuing $1.86K. Also, the short liquidation was worth $64.77, showing the sellers’ dominance in the token price.
A rise of 17% in the BEAM token’s derivatives volume was recorded, resulting in a traded value of $7.98M. This showed an increase in the trading activity of token derivatives.
Let’s Take A Look At BEAM Token Technical Chart
The BEAM crypto has been entrenched in a pronounced downtrend, consistently forming lower lows on the daily chart. This pattern highlights the strong bearish pressure that has dominated the market.
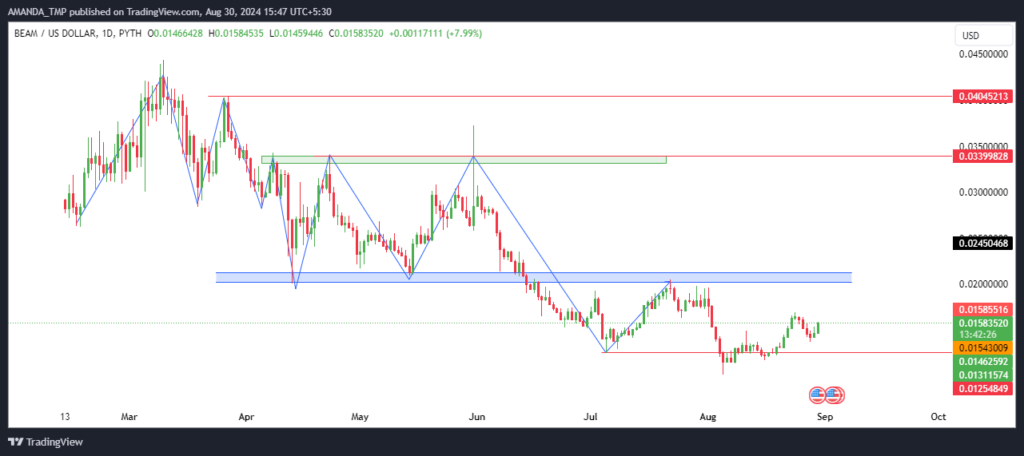
A potential rebound in the BEAM price is expected to encounter significant resistance. This could trigger a liquidity grab, potentially driving the price back to previous lows. Recent breaches of critical support levels have further reinforced the likelihood of continued downward momentum.
Technical indicators also point to sustained bearish activity in the near term, suggesting that the current downtrend may persist as the market remains under pressure.
What Does BEAM Token’s Technical Indicator Indicate?
The technical indicators for BEAM crypto revealed uncertainty in its price trend. At press time, the death crossover between the 20-day and 50-day EMAs is a key signal of potential bearish momentum.
This crossover typically indicated a shift towards a downward trend. It signaled a possible continuation of the current bearish phase.
BEAM/USD Chart by TradingView
Additionally, the Moving Average Convergence Divergence (MACD) and the signal line have been trading neutrally, overlapping each other. This neutral positioning reflected a lack of clear direction in the market, underscoring the current indecision among traders.
The RSI further supported the bearish outlook. Initially, the RSI found support at the 50 level, but it has since declined below the 14-day Simple Moving Average (SMA). This decline has signaled a weakening of bullish momentum and the potential continuation of the bearish cycle.
Regarding key levels, the BEAM crypto might find support at $0.050 and $0.010, with resistance expected at $0.20 and $0.0330. These levels will be crucial in determining the token’s near-term price action.
Disclaimer
This article is for informational purposes only and does not provide any financial, investment, or other advice. The author or any people mentioned in this article are not responsible for any financial loss that may occur from investing in or trading. Please do your research before making any financial decisions.




