
 Minter
 Quack AI
 STONK
STONK Pons
Pons Sui
Sui Pearl
Pearl Bittensor
- The top 10 holders of the Aptos token hold only 9.68% of the total supply.
- The APT token price volatility was high, hovering around 6.7%.
APT traded in a strong downtrend as the price witnessed profit booking for a long time. Despite this, the token price recently broke above certain levels which showed signs of optimism in price.
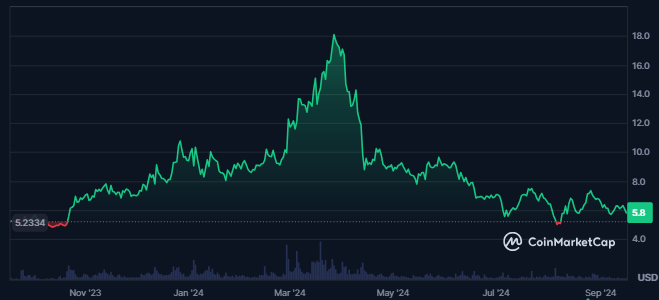
Despite this, the value of the traded volume for the token has advanced by 28% in the last 24 hours, which has resulted in a traded value of $77.766 Million. The token’s liquidity is very low, as the volume/market cap ratio is 2.60%.
The token’s price has advanced by 88% from its all-time low price, which was formed six years ago. Despite this, the Aptos token’s price was down by 70.7% from its all-time high price of $19.90, achieved on January 30, 2023.
The sentiment of the token has been bearish, followed by the fear and greed index at 39, which showed fear among investors.
Derivatives Data Displays Seller Dominance
The shorts liquidated in APT crypto over the last 24 hours were worth $15.36k, while longs worth $457.41K were liquidated, reflecting larger profit bookings in the token’s long positions.
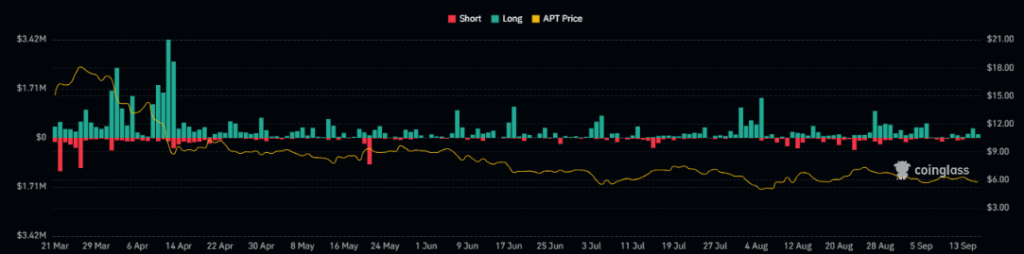
The liquidation chart displayed higher long liquidations over the last few weeks. This indicated that bears dominate the price, which has led to a huge decline in the token’s price.
The value of the derivatives traded volume of the token has witnessed an advance of 27.7% over the last 24 hours from the press time. This has resulted in a traded value of $154.32 Million.
The value of the open interest witnessed a decrease of 7.3%, which showed a decline in the open positions of the token’s future.
APT Token Price Again Started to Witness Profit Booking
The APT token has recently shown a shift in its price movement, marking a higher high swing after a prolonged period of decline.
This development signals a potential reversal; however, the broader technical structure of APT remains bearish. For several months, the token has consistently followed a lower-low swing pattern, reflecting a persistent downtrend.
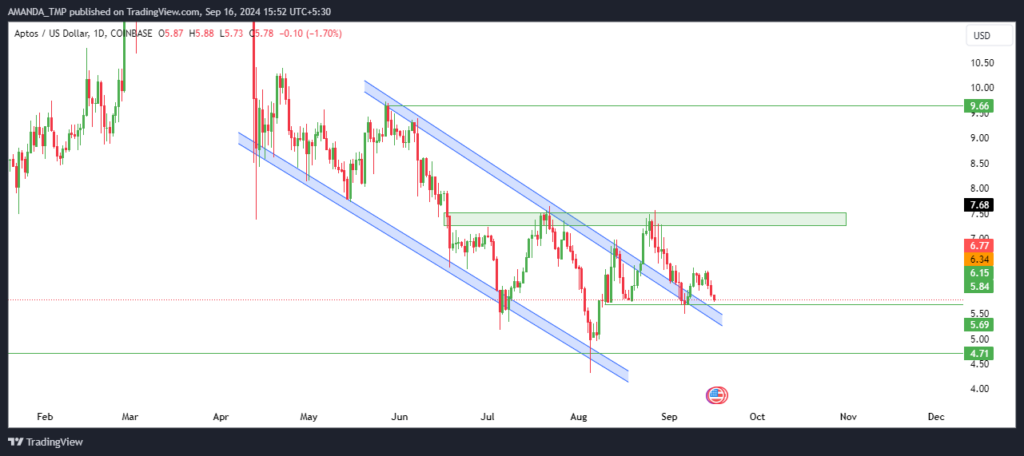
Since reaching its swing highs in March 2024, APT’s price has plummeted by 70%, signaling sustained downward pressure.
This sharp decline has led to the formation of a falling wedge pattern on the daily chart, which often indicates a potential bullish reversal. Despite breaking out above the wedge pattern, the token is yet to recover fully.
Following the breakout, APT encountered renewed selling pressure, leading to the formation of bearish candlesticks. This suggests that, while the token’s price has moved above the wedge, it continues to face significant resistance, making its future trajectory seem uncertain.
Let’s Dive Deeper Into Aptos Token’s Technical Indicators
In the latest analysis, the APT token price is facing resistance at the 50-day exponential moving average (EMA). The technical indicators reveal a death cross formation, as the 50-day EMA fell below the 200-day EMA, signaling potential short term bearish momentum.
APT/USD Chart by TradingView.com
Despite this bearish signal, the moving average convergence divergence (MACD) indicator gives an uncertain outlook. The MACD and its signal line overlapped at the zero level. Notably, a death cross recently appeared on the MACD.
Further supporting this outlook, the relative strength index (RSI) showed weakness by breaking below its 14-day simple moving average (SMA) and closing below the 50-zone on the daily chart. This signals an increase in bearish momentum, indicating that the token could experience downward price action.
The APT token is expected to find support at $4.70 and $5.50. On the upside, resistance is projected at $9.60 and $14.30, which could pose significant challenges if the bullish momentum persists.
Disclaimer
This article is for informational purposes only and does not provide any financial, investment, or other advice. The author or any people mentioned in this article are not responsible for any financial loss that may occur from investing in or trading. Please do your research before making any financial decisions.




