
 Quack AI
 Bitcoin
 Lighter
 Injective
 Pearl
Pearl Zcash
Zcash Sui
Sui
- HEX token currently holds a fully diluted market cap of $4.69 billion with high price volatility.
- Technical indicators such as the MACD and RSI show strong bearish momentum. In contrast, recent bullish candles hint at a possible short-term recovery.
Over a long time, the HEX (Pulsechain) has witnessed strong profit booking. This profit booking has led the HEX price to significantly lower levels. Following this most recent scenario, buying can be seen from lower levels.
This analysis delves into the current market dynamics of the HEX price. The piece examines its price trends, trading activity, and holder data.
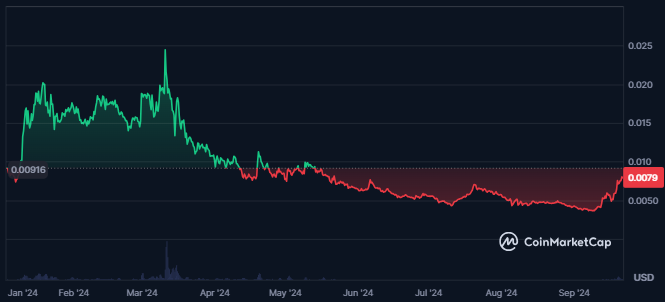
HEX Price Faces Uncertainty Amid High Volatility
The cryptocurrency in question has held a fully diluted market capitalization of $4.69 Billion, as reported by Coincodex. Current sentiment surrounding the asset remains bullish, indicating positive market expectations.
However, the volatility level of the crypto stood at a notable 30.11%. It suggested the potential for future fluctuations in the HEX price and uncertainty in its trading patterns.
At press time, the token maintained a market cap of $428.40 Million, with its price trading around $0.007915. Over the past 24 hours, the asset has experienced a 20.3% decline in trading volume. This brought its total traded value to $1.69 Million. This decrease in activity could signal a shift in market dynamics or investor interest.
In the case of Hex, the volume-to-market cap ratio is 0.008, while the market cap dominance remains minimal at 0.02%. Based on CoinMarketCap data, HEX crypto ranked #2780 in terms of market capitalization. These metrics reflected its current standing within the broader crypto market.
What Does HEX Crypto’s Holders Data Indicate?
At press time, the HEX crypto had 334K holders. Its largest single holder has held 43.93% of the total supply.
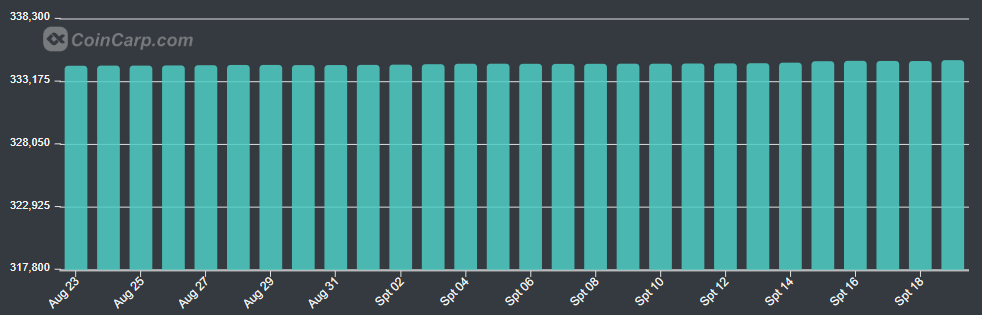
The holder’s data chart showed a rise in token holders over time. This showed an increase in investors’ confidence in the token.
The token’s top 10 holders held 64.05% of the token’s total supply. Also, the total staked value of the token was worth $134.39M, followed by a liquidity of $5.4M.
Let’s Further Explore The HEX Token’s Technical Price Chart
The HEX crypto has been caught in a persistent downtrend. It has experienced a significant decline of 72% from its all-time high of $0.0292. The HEX price stabilized at lower levels following this steep drop, signaling a temporary pause in the downward momentum.
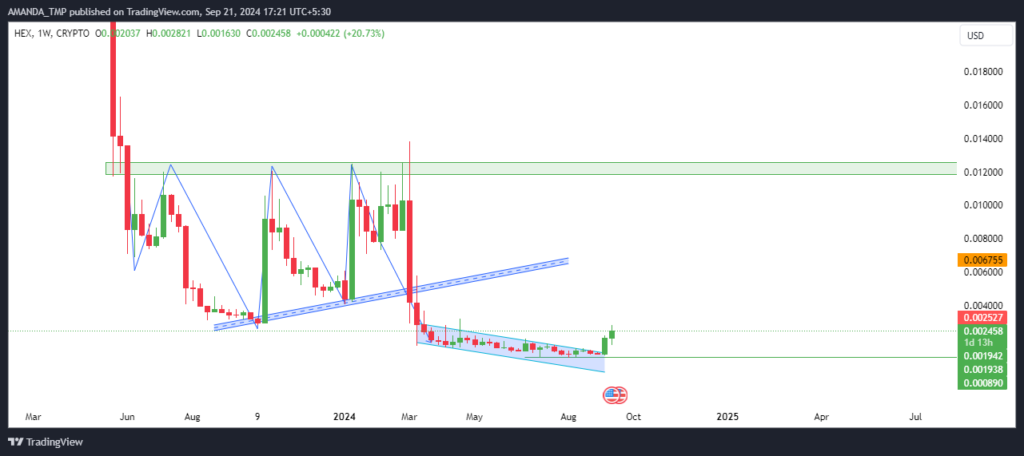
This stabilization led to a rising wedge pattern, typically a bearish signal. However, the price failed to hold above this pattern and eventually broke down, resuming its decline.
Since the breakdown, the token has consistently trended toward lower levels. This reinforced the overall bearish sentiment.
Despite this, the token has recently shown signs of a potential reversal. Two strong bullish candles have formed on the weekly chart, suggesting an attempt to recover from its recent lows. These signals may indicate the possibility of a short-term upward movement as buyers re-enter the market.
HEX Crypto’s Technicals Show Strong Seller Dominance
The HEX crypto chart showed a bearish outlook, with the EMAs trading in a bearish crossover. The 50-day and 200-day EMAs were trending downward, reflecting the continued price decline to lower levels. This movement signaled sustained bearish momentum in the market.
HEX/USD Chart by TradingView.com
Further confirming this trend, the MACD and signal line have dropped significantly below the zero level, highlighting strong seller dominance in the market. This indicated that bearish pressure continues to control the HEX price action.
Additionally, the RSI on the daily chart is following a bearish cycle, having moved into oversold territory. The RSI has also fallen below the 14-day SMA and is currently at 45.0.
This suggested that bearish sentiment remained prevalent. However, the oversold conditions may signal a potential rebound in the near future.
The HEX token price might take support at $0.00050 and $0.00090. This would be followed by the resistance levels of $0.0130 and $0.0240.
Disclaimer
This article is for informational purposes only and provides no financial, investment, or other advice. The author or any people mentioned in this article are not responsible for any financial loss that may occur from investing in or trading. Please do your research before making any financial decisions.




