Quack AI
 XRP
 Pudgy Penguins
 Bitcoin
 Lighter
 Pearl
 Irys

- SUI crypto encountered profit booking and revisited the 20-day EMA mark.
- The long-term uptrend is intact, and gains could be regained shortly.
After a massive bullish rally, Sui (SUI) crypto stepped down from the top and witnessed a retracement of over 5% this week. Near the crucial supply region around $2, bears defended the region and pushed the bulls.
Meanwhile, the long-term uptrend was intact, and after a series of higher highs, a higher low near the 20-day EMA was formed. This week, the SUI price progress stopped, and the bull army lost momentum, resulting in a significant decline.
However, SUI crypto retested the 20-day EMA support zone and was finding a way to recover the gains.
Will SUI Crypto Rebound From the 20-Day EMA Zone?
After recording a massive triple-digit surge of over 110% in the last three months, SUI crypto made a local top around $2.18. Since this month’s beginning, buyers seem uninterested in accumulating more and have booked their profits off the table.
At press time, the SUI price was trading at $1.90, with an intraday decline of over 4.30%. This replicated minor profit booking from the highs. With a market cap of $5.26 Billion, SUI crypto is positioned as the 20th largest crypto among the top cryptos.
Crypto Analyst @CryptoBullet, in his tweet, said that SUI crypto has made a cup and handle pattern that is considered bullish. Moreover, this is the 4th attempt to break the $2 wall.
Typically, when a significant level was retested multiple times, the possibility of breakout was increased. Considering this, the $2 mark breakout is likely, and the SUI token may see further upside in the near sessions.
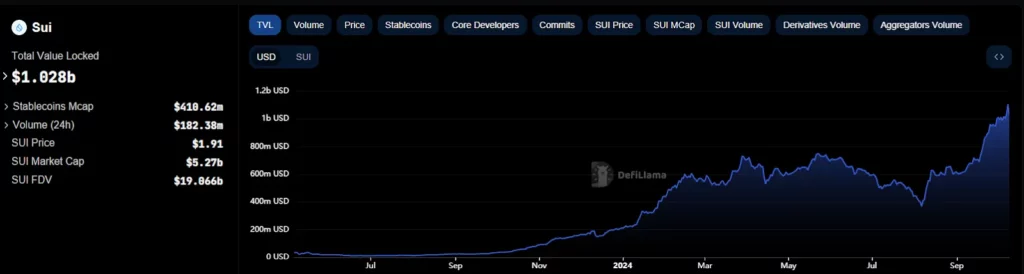
SUI crypto’s Total Value Locked (TVL) data highlighted massive network growth and investor confidence in the network. For the past few months, the TVL was on the rise, at $1.02 Billion at press time.
The ongoing price action conveyed a series of higher highs and higher lows. Also, a rising channel pattern was observed. An aggressive selloff may only be seen once the ascending trendline level of $1.60 is breached.
What Do On-Chain Metrics and Indicators Say?
The Relative Strength Index (RSI) curve displayed a negative divergence. The value slipped below the midline region, near 43 at press time, directing a minor retracement from the top.
Moreover, the Moving Average Convergence Divergence (MACD) indicator histogram turned red and displayed a bearish crossover.
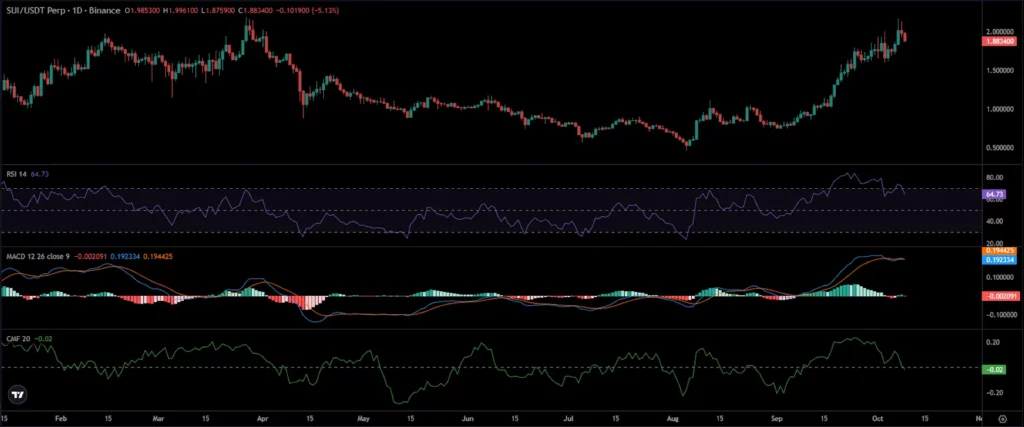
Similarly, the Chaikin Money Flow (CMF) readings give a neutral outlook, -0.02 at press time. This means that the liquidity exit is triggered in the market.
A look at the Futures Open Interest (OI) data proves that bulls seem interested in booking their gains. The Open Interest shed over 9.80% to $515.63 Million. Typically, when OI declines alongside price declines, it signals a long, unwinding move.
The immediate support zone was $1.75 and $1.60. At the same time, the resistance levels were around $1.90 and $2 mark.
Disclaimer
This article is for informational purposes only and does not provide any financial, investment, or other advice. The author or any people mentioned in this article are not responsible for any financial loss that may occur from investing in or trading. Please do your research before making any financial decisions.