
 Sword Inu
 no crying in the casino
 streamoors
 IGNITION
 Altai the Tiger
 Pearl
Pearl Quantus
- MARA Holdings’ price dropped 6.37% in the previous trading session.
- RSI has displayed a sharp death crossover, indicating a bearish signal.
- This recent dip could be a bargain and may rebound.
MARA Holdings, Inc. has been consolidating in a higher low zone and has witnessed price rejection from a crucial level of $19. It has declined by 9.78% in the past 3 days and has dropped below the 200-day EMA. It has been struggling from $18.86 to $15 since August.
Since December 2023, the MARA Holdings price has defended the significant support level of $15. This level could play a vital role in rebounding the price.
MARA Holdings Price Technical Analysis: Is Breakout on Its Way?
MARA Holdings price has been in a consolidation phase in a daily time frame. Also, the token showed neutral momentum. The RSI was at 49.93, demonstrating neutral momentum. The price has received continued pushes from the downside.
The MARA stock price has slipped below the key moving averages. It is heading for a significant support level of $15. Here, buying pressure can be seen as it has been doing for a year.
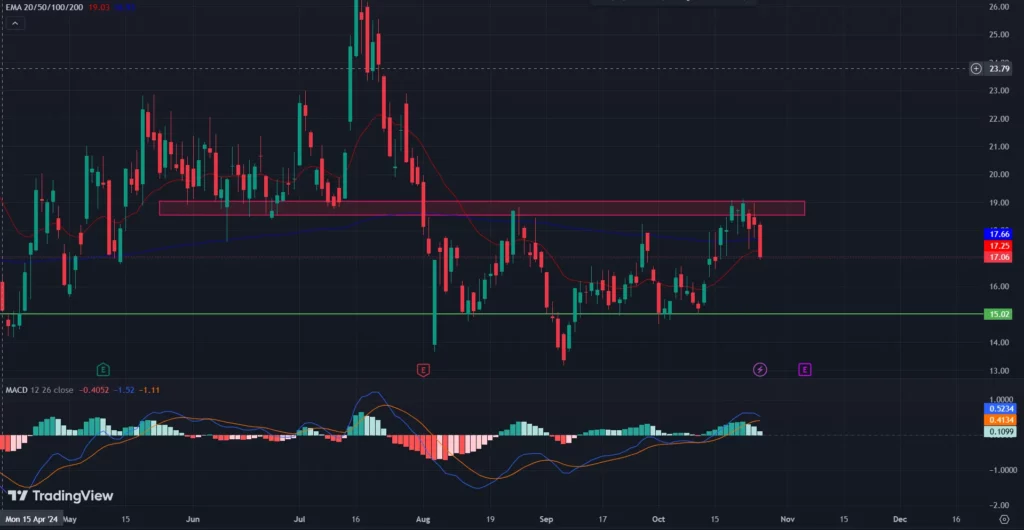
The MACD and the Signal line stayed over the Zero line, and the histograms are green. This could favor the bullish forecast.
TradingView reports that MARA is down 23.39% so far this year. However, it still faces significant resistance at $19.00. The uptrend may continue if there is a break above this level. The price may pull back if it cannot maintain support at $15.
MARA Price May Shoot Up Soon: Analysts Weigh In
On the daily $MARA chart, an analyst named Volatility saw two conventionally bullish reversal patterns. The patterns were an inverse head and shoulders and a falling wedge.
The $23 is the target after breaking through the upper boundary of the wedge. The falling wedge suggested that the MARA Holdings price was about to break out.
Additionally, if it breaks the neckline, the inverse head and shoulders formation of the neckline at about $17.10 indicates the potential for an upward move.
Additionally, Volatility pointed to a double top at $19.19, which triggered the most recent decline. At $17.50, there was strong buying interest, which stopped the price from falling to $16.50. If $19.19 is broken, MARA might reach $23.
MARA Price Analysis Based on Technical Chart
MARA Holdings, Inc. was trading at $17.06 with an intraday loss of 6.37%. The market capitalization was $5.02 Billion, and the average trading volume was $35.89 Million. The next estimated revenue is $145.328 Million.
The MARA price has displayed a short-term dip, which could invite buyers to discount. If the $MARA price bounces back and surpasses the key moving averages, buyers may become confident. Suppose the price smashes the $19 mark with good volume; the price may rally to $25 in the next few weeks.
On the other hand, if the asset price fails to exceed the $19 mark, it may consolidate for a longer time. Once the price slips below the major support level of $15, it could generate a panic situation among buyers. Beneath this level, most investors might prefer to protect their capital. This could lead to a sharp selling.
Disclaimer
In this article, the views, and opinions stated by the author, or any people named are for informational purposes only, and they don’t establish the investment, financial, or any other advice. Trading or investing in cryptocurrency assets comes with a risk of financial loss.



