
 Zylo Ecosystem
 Pearl
Pearl Walrus
 Derive
 Quantus
 Aerodrome Finance
 Sui
Sui
- 78.30% of traders on BitMEX and 52% on all exchanges with open ETH futures trades were betting on increasing the price.
- Ethereum could hit $6500 as it resembles a post-2020-halving rally.
Ethereum (ETH) has established a crucial support level of around $3300. Furthermore, the ETH price has shown resilience after recent market volatility.
The Ethereum price prediction has demonstrated an apparent sideways movement. With this, the current trading activity centered around this key support zone.
At press time, the ETH price traded at $3359, noting an intraday decline of over 1.27%, showing range-bound movements. Its market cap stood at $403.62 Billion.
Ethereum Bulls Take the Lead
Data from Coinglass showed that Ethereum’s long/short ratio indicated a bullish sentiment among traders. Particularly notable was BitMEX, where a staggering 78.3% of traders were positioned long. That indicated a strong belief in the ETH price’s upward trajectory.
This shift in positioning is particularly significant given the recent Ethereum consolidation phase. The aggregate sentiment on all exchanges also leans positive, with 52% favoring long positions over shorts.
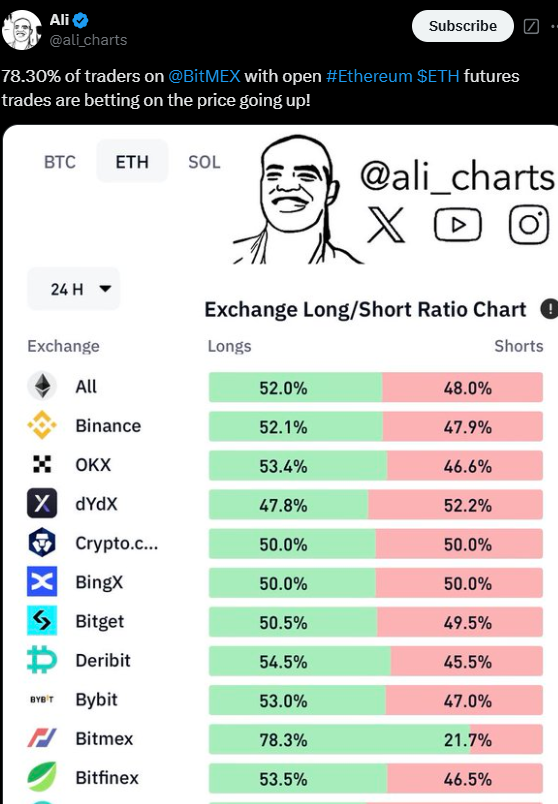
This trend was reflected in other significant exchanges like OKX and Bybit. There,longtshortng percindicates53.4% and 53.0%, respectivereinforcing the optimistic outlook.
Ethereum Price Prediction: Is a Rally Toward $6500 Imminent?
Ethereum price prediction had a high level of volatility compared to other assets compared to the 2020 post halving rally. The ETH price could precede a bullish movement as it forms a bullish pennant formation.
Historically, such patterns presaged bullish outcomes, which in 2020 corresponded to Ethereum. That, steadily rose after following a similar setup. Still, the 2021 chart portrayed this bullish bias, highlighting periods of steep ascents interjected by flattening phases.
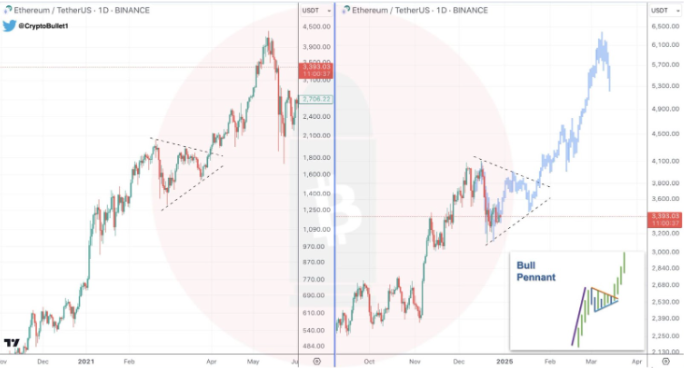
The pattern similarity between the two-time frames strengthened the case for ETH reaching the $6500 target. Notably, the ETH price action in late 2020 and early 2021 set the stage for record highs. If the current pattern holds, similar outcomes could be expected.
The potential bull pennant pattern for Q1 of 2025 suggested accumulation. At the same time, a breakout pointed to robust buying interest that could propel prices toward $6500 in mid-year.
Ethereum’s Market Dominance Signals Renewed Optimism
A comparative analysis of Bitcoin‘s dominance and ETH/BTC price action highlighted significant market dynamics. It shown through the market dominance, which depicted a gradual decline, pointing toward declining market interest.
This was coupled with a decline of over 57.75%, suggesting a shift in market sentiment or diversification into other crypto assets.
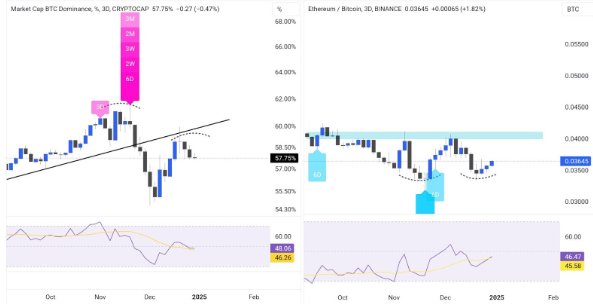
On the other hand, Ethereum showed a different picture and resilience, signaling a bullish trend. Looking at the historical data, the ETH price has demonstrated its relative strength and a bullish trend against Bitcoin in Q4 2024.
The pattern of this pair was marked by an uptrend, consolidating around 0.03645. This showcased ETH’s increasing strength relative to Bitcoin.
The Bitcoin’s decreasing dominance with Ethereum’s comparative price strength against Bitcoin recorded synchronization. This synchronization suggested a potential market dynamics shift favoring Ethereum.
If it continues, this trend could imply significant market movements. Witht his, the ETH price could potentially outpace Bitcoin in certain aspects of market influence.
Disclaimer
This article is for informational purposes only and provides no financial, investment, or other advice. The author or any people mentioned in this article are not responsible for any financial loss that may occur from investing in or trading. Please do your research before making any financial decisions.




