
 Dacity Coin
 Zcash
Zcash Celestia
 Bitcoin
 Pearl
Pearl Injective
 Pons
Pons- After a strong bullish trend, the XRP price has undergone a correction phase.
- Ripple XRP has formed a bullish candlestick pattern on top.
- Technical indicators signal a breakout in the Ripple coin’s price.
The Ripple (XRP) price has experienced a massive bullish trend and witnessed decent gains. Since November, the XRP price has risen from $0.500 to $2.50. The bullish trend was interrupted near the $2.85 mark and showed weakness. XRP coin’s price has kept falling through a descending channel since the beginning of December.
Amid this fall, the price has managed to reach the upper trendline and consolidating in a narrow range. The RSI suggests a breakout from the channel which may help to continue the bullish trend. Analysts believe that the Ripple XRP price has the potential to hit the $5 mark amid this bull run.
Another Bullish Rally in XRP Price? Analysts Weigh In
Crypto EA, a cryptocurrency analyst, has claimed that investors are still bullish on Ripple. The price of XRP had triggered a pullback on a weekly time frame and is heading toward the last swing high. The price has taken support on the 7-MA (Moving Average) and has gained bullish momentum.
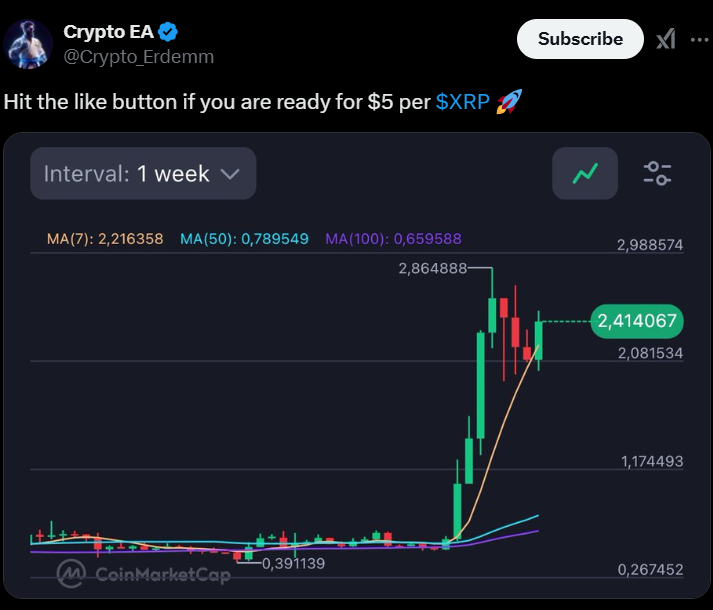
Suppose buyers remain bullish, the probability of upward momentum can be increased. Once the price surpasses the last swing high, it might extend to the $5 mark in a single run.
The Ripple (XRP) Price Has Shaped a Flag & Pole Pattern
The XRP price was trading at $2.39 at press time, which has remained neutral over the past 24 hours. The market capitalization was $137.93 billion, and the 24-hour trading volume was $4.25 billion.
Based on the chart structure, the price has bounced back from the lower support level (lower trendline). By taking support, the price has exceeded the 20-day EMA and has reached the upper trendline.
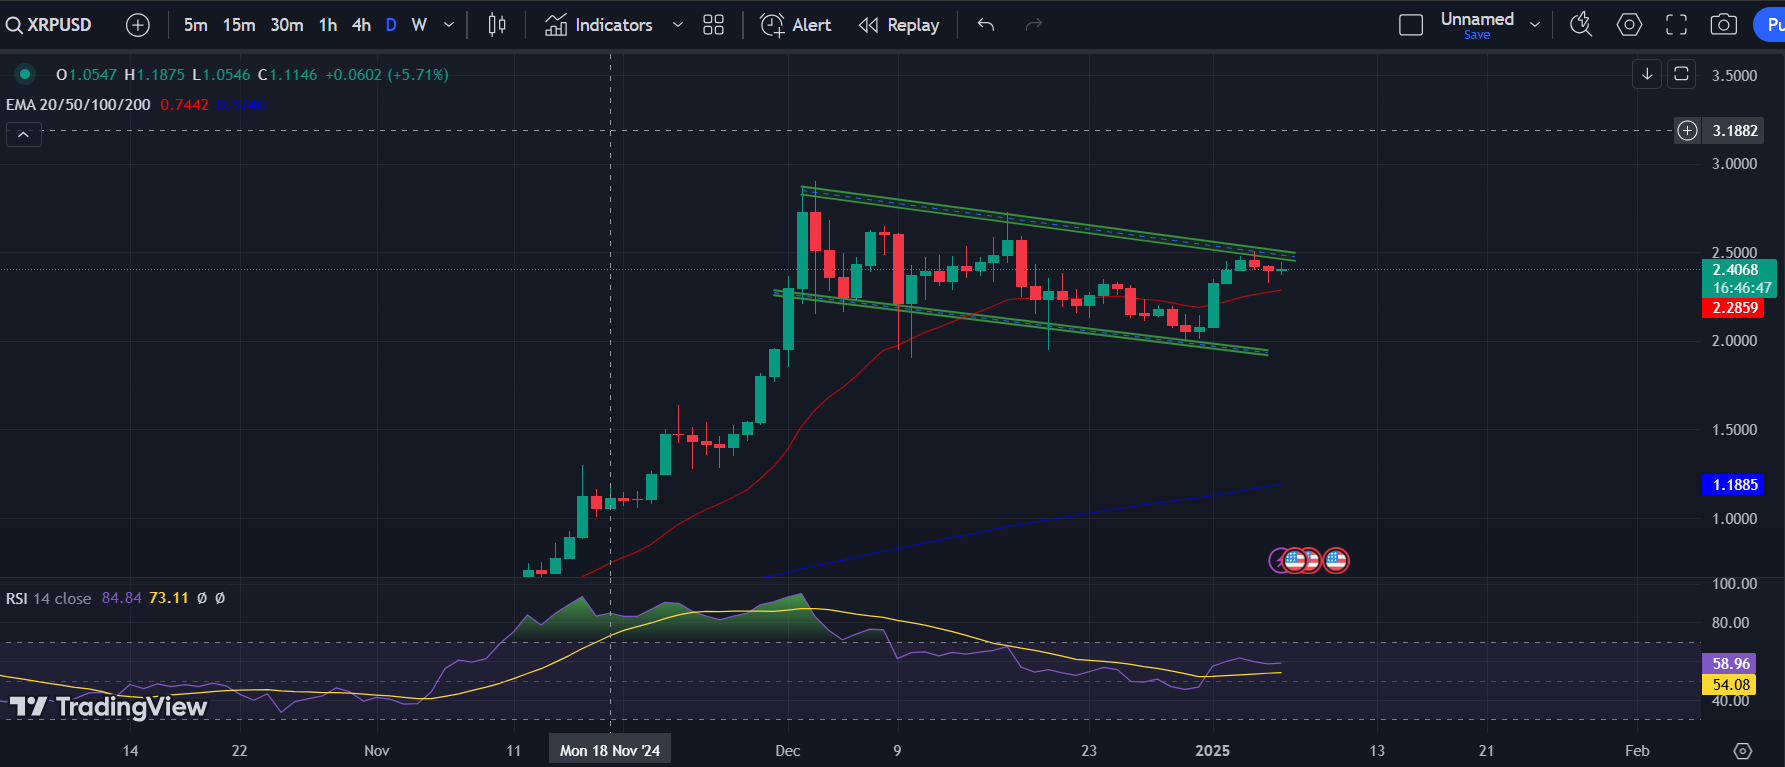
Suppose the price of XRP triggers a breakout from the flag and pole pattern, it could be a bullish signal. Once the price manages to sustain over this channel, buyers might keep pushing the price. The price might display decent gains and hit the $5 mark amid this bull run.
Alternatively, if the Ripple price faces resistance from the upper trendline, a selling signal can be generated. If the price slips below the channel, it may keep falling for the next few weeks. Here, a profit booking scenario can be generated, and a decent selling pressure can be experienced.
Turning to the technical indicators, the RSI has triggered a golden crossover with the RSI-based moving average. The MACD has displayed a bullish crossover with the Signal line and stayed in positive territory. The histograms have flipped to green which showcases the bullish forecast.
XRP Price Analysis Amid This Bull Run
The XRP price has shown signs of recovery and potential bullish momentum after a correction phase. Technical indicators such as the RSI and MACD suggest a possible breakout, supporting the idea that XRP could rise toward the $5 mark if buying pressure continues. The formation of a flag and pole pattern adds to the optimistic outlook, but there are risks involved if the price encounters resistance at the upper trendline.
If XRP can maintain its position above key support levels and sustain upward movement, it may indeed see substantial gains in the current bullish trend. However, caution is advised as any drop below the channel could signal a bearish reversal and lead to further declines.
Disclaimer
This article is for informational purposes only and provides no financial, investment, or other advice. The author or any people mentioned in this article are not responsible for any financial loss that may occur from investing in or trading. Please do your research before making any financial decisions.




