
 Covenant x402
 hi
hi Pearl
Pearl Quantus
 Pudgy Penguins
 Boomer
 Lighter
- Bitcoin price again reached the $100K mark and trading volume surged by 56% in a day.
- BTC price has surged by 8% in a week.
- Bitcoin price has surpassed the 20-day EMA and is eyeing a breakout.
On a wider time frame, Bitcoin (BTC) price has been in a bullish trend and has achieved the milestone of the $100K mark. After this bull run, the price underwent a consolidating phase. It has been hovering near the $100K mark since mid-November. Amid this consolidation phase, the Bitcoin USD price took support at the $92K mark and bounced back.
During this bullish move, BTC price broke out from the 20-day EMA and halted over it. After a two-day pause, the Bitcoin price formed good green candlesticks which might invite bulls. Moreover, the price has reached a resistance zone of $100, and a breakout is awaited.
Bitcoin Liquidity Building at What Levels?
Strong market expectations for prices to cross this threshold are indicated by the buildup of Bitcoin liquidity above $100,000.
Such liquidity accumulation has historically frequently occurred before notable price movements, acting as both technical and psychological resistance levels.
A surge in buying activity might result from Bitcoin breaking out of this liquidity zone, which could drive prices higher.
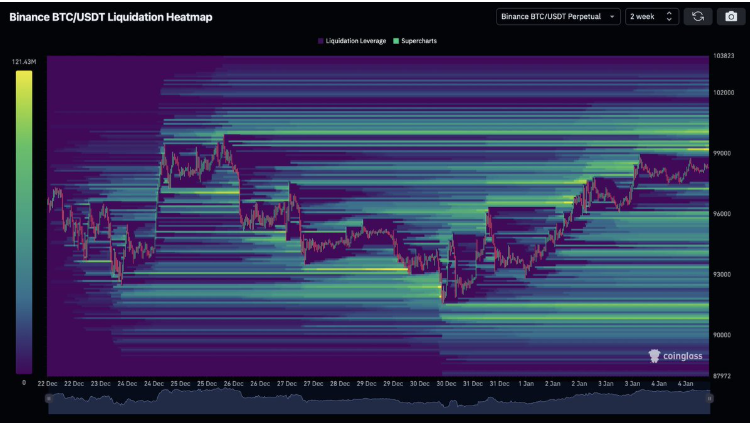
This situation would boost market confidence and draw in more investors, generating a positive feedback loop that might push Bitcoin to all-time highs.
According to the liquidity’s strategic placement, significant volatility and perhaps a new bullish cycle for Bitcoin could occur if these levels are tested.
Bitcoin Price in a Range and Eyeing For Breakout
When writing, Bitcoin crypto was trading at $99,150.00 which has increased by 0.80% over the past 24 hours. The market capitalization was $1.96 Trillion and the 24-hour trading volume was $30.87 Billion.
BTC price has been struggling in a parallel channel for the past few months. However, the price has reached the upper resistance level of $100K and is waiting for a breakout. If the price of Bitcoin triggers breaks out from the channel, it could invite buyers.
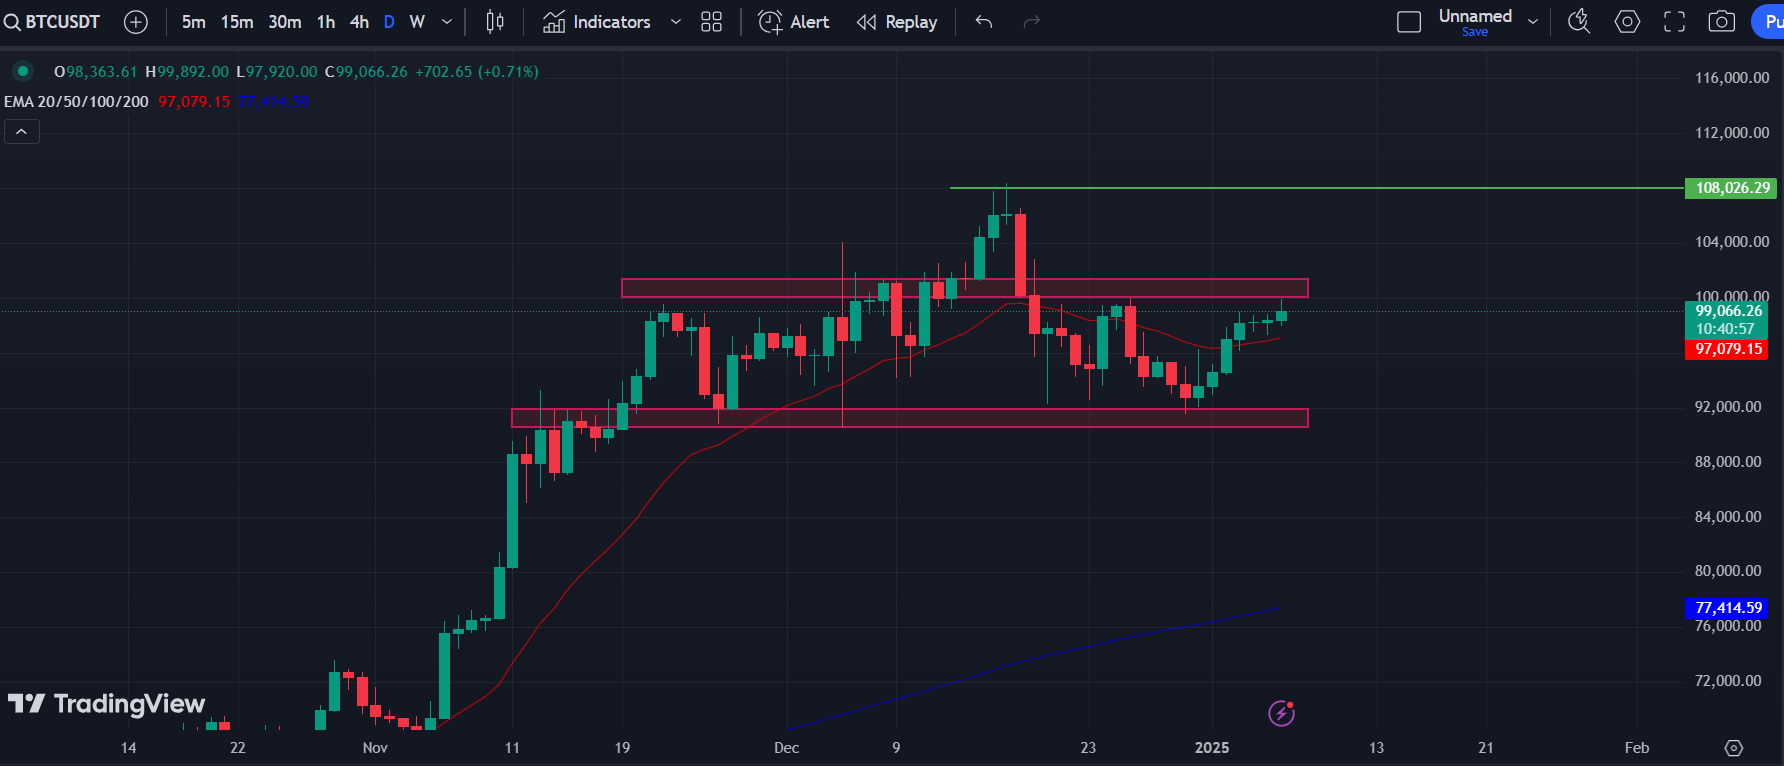
Once the price sustains over the channel, bullish momentum can be anticipated. If the price holds over the $102K mark, more bullish momentum can be anticipated. If the trading volume supports this momentum, bulls might lift the price to a new all-time high.
Alternatively, if the price faces resistance from the $100K mark, it might generate a panic situation among bulls. If the price forms a bearish candlestick pattern near the $100K territory, it would be a selling opportunity. Once the price loses the parallel channel, massive selling pressure can be experienced.
BTC Price Analysis and Forecast Based on Key Levels
Bitcoin is currently navigating a crucial phase around the $100,000 mark, experiencing a consolidation period after a bullish run. The recent surge in trading volume and price demonstrates strong market interest, particularly as the liquidity builds above this key threshold. A breakout beyond the $100K resistance could trigger an influx of buying activity, potentially leading Bitcoin to new all-time highs.
However, the market remains sensitive to price movements near this level. If Bitcoin price fails to sustain its position above $100K and encounters resistance, it may prompt a wave of selling pressure. Thus, traders and investors should closely monitor price patterns and trading volumes to gauge market sentiment and make informed decisions in this volatile environment.
Disclaimer
This article is for informational purposes only and provides no financial, investment, or other advice. The author or any people mentioned in this article are not responsible for any financial loss that may occur from investing in or trading. Please do your research before making any financial decisions.




