
 Minter
 Quack AI
 Pearl
Pearl Monero
 The Sandbox
 Pons
Pons Bittensor
- Hedera’s price has just slipped below the 20-day EMA.
- HBAR price is set to lose 10% as per the chart structure.
Hedera (HBAR) price has witnessed a strong bullish rally for the past few months. However, the bullish trend was disturbed near the $0.38 mark and displayed a decent fall. Every time, the HBAR price failed to reach its previous swing, which showcases weakness.
Recently, the Hedera price has resisted the descending trendline and reacted negatively. Amid this fall, the price has lost the 20-day EMA and is heading for the support level of $0.25.
Fluctuation in Outflow and Inflow Noticed: What Could Be Its Outcome?
Over the past seven days, spot flows, in particular, have stayed mainly in the bears’ favor. At the time of observation, just over $3 Million in inflows were made during the last 24 hours. However, by the end of the day, outflows had increased by more than $7 Million.
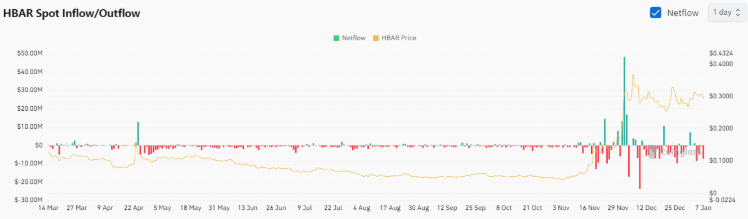
The negative spot flows demonstrated the market’s lack of confidence. This was despite previously noted hope that the sell pressure wave that began in December would pass quickly.
Additionally, it ran counter to recent market fervor, particularly concerning the HBAR crypto. This is because its weighted funding rates have stayed positive over the past seven days.
Hedera Price Shaped a Descending Triangle
When writing, the HBAR price was trading at $0.279 with an intraday loss of $3.18% in an intraday session. The market capitalization was $10.73 Billion, and the 24-hour trading volume was $1.1 Billion.
During the daily time frame, the Hedera price forms a descending triangle. Based on the technical chart, the token is supposed to take support at the support level of $0.25.
Suppose the price takes support on the $0.25 level and forms any bullish candlestick pattern; buying could be expected. Once the HBAR crypto price departs from this level, it might travel to the descending trendline.
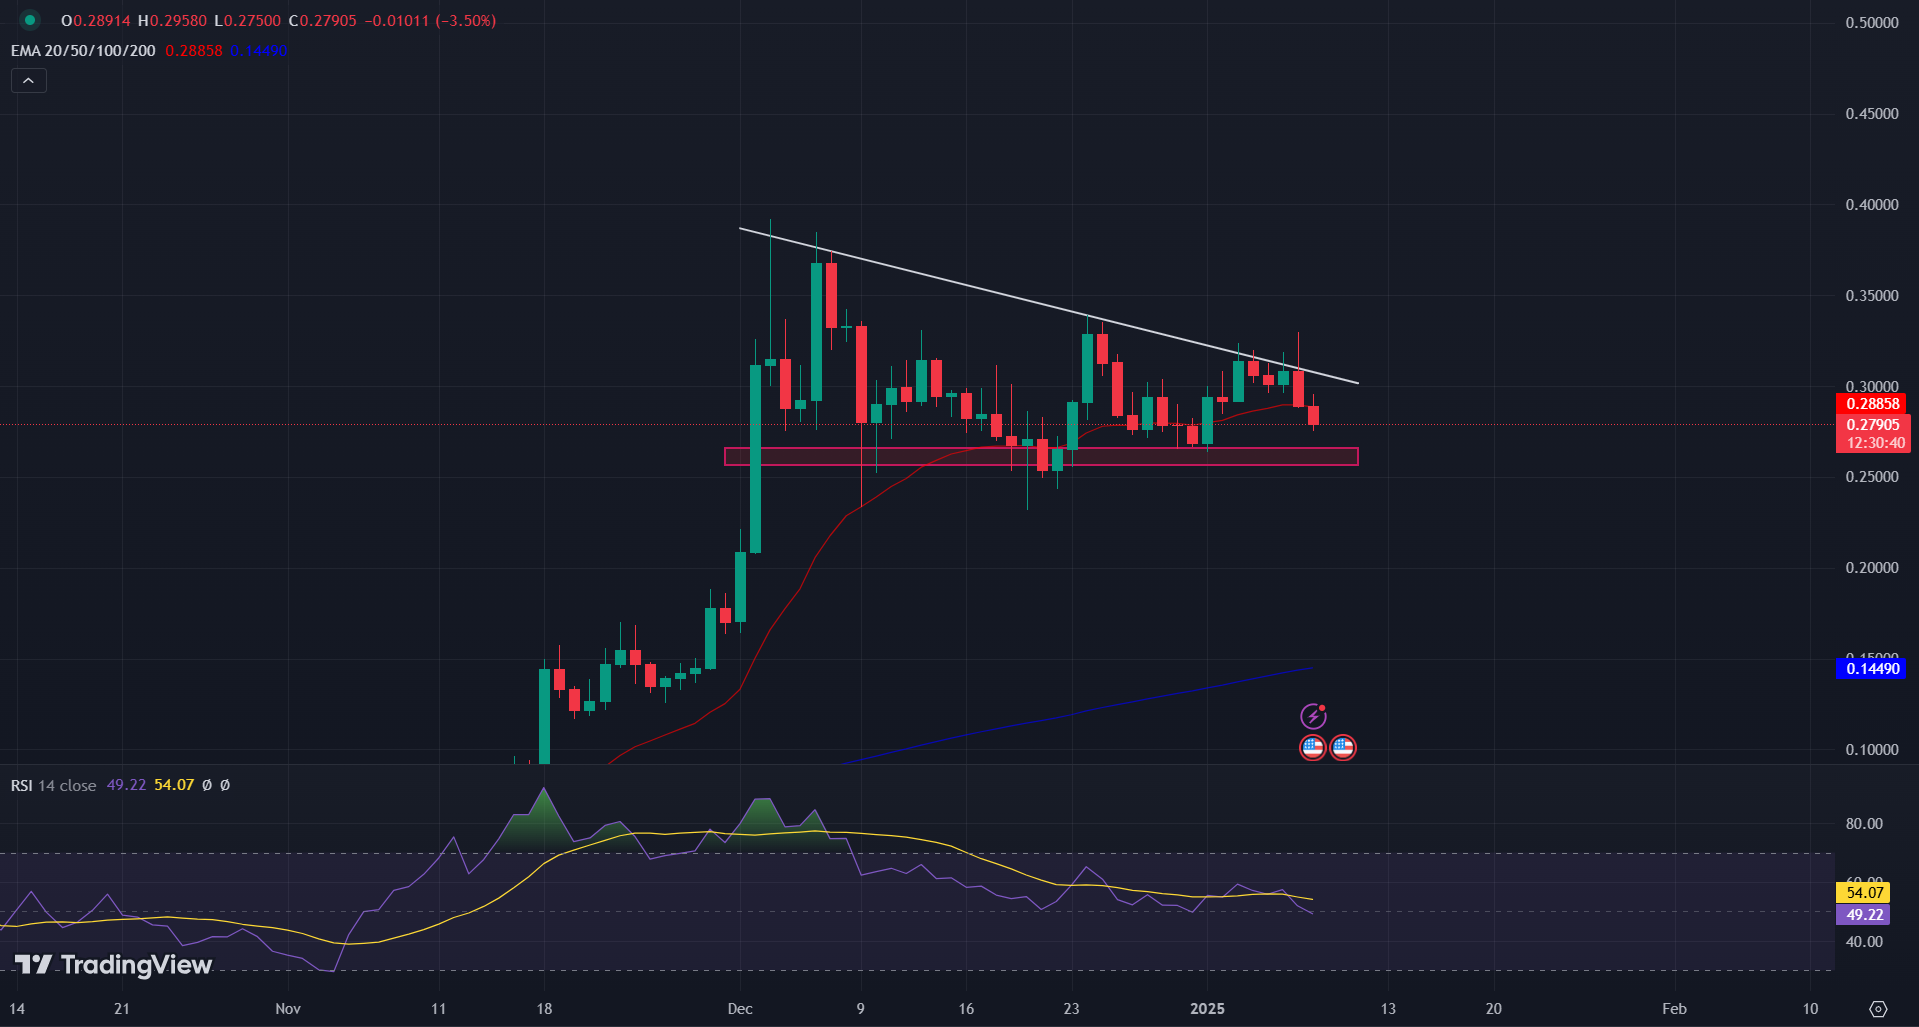
If the price triggers a breakout from the triangle, buying pressure can be experienced. A successful breakout could lead to a massive bull run, and a new all-time high can be recorded.
Alternatively, sellers might be attracted if the HBAR price dives below the $0.25 level. Most investors and traders might prefer to square off their active long position. Profit booking may lead to strong selling pressure.
RSI has dropped below the RSI-based moving average, which showcases the bearish forecast. The MACD and the Signal line continuously fall, indicating the sellers’ grip.
HBAR Price Overview and Its Forecast
The Hedera price has experienced a significant price decline. It was trading below key support levels and facing resistance from a descending trendline.
Negative spot flows and fluctuations in inflow and outflow highlighted the recent bearish sentiment. That indicated a lack of market confidence.
As the price approaches the critical support level of $0.25, traders are on high alert for potential bullish patterns. These bullish patterns could trigger a buying opportunity.
However, if the HBAR price falls below this level, it may attract increased selling pressure as investors look to secure profits. Technical indicators, such as the RSI and MACD, further suggested a bearish outlook in the near term.
Disclaimer
This article is for informational purposes only and provides no financial, investment, or other advice. The author or any people mentioned in this article are not responsible for any financial loss that may occur from investing in or trading. Please do your research before making any financial decisions.




