
 Reboot
 Dacity Coin
 Harmony
 Bitcoin
 Pudgy Penguins
 Hyperliquid
 Pi Network
- PEPE token formed a double top pattern on the chart, signaling bearishness.
- A whale moved 427B tokens worth $8.5M to Kraken, sparking concern.
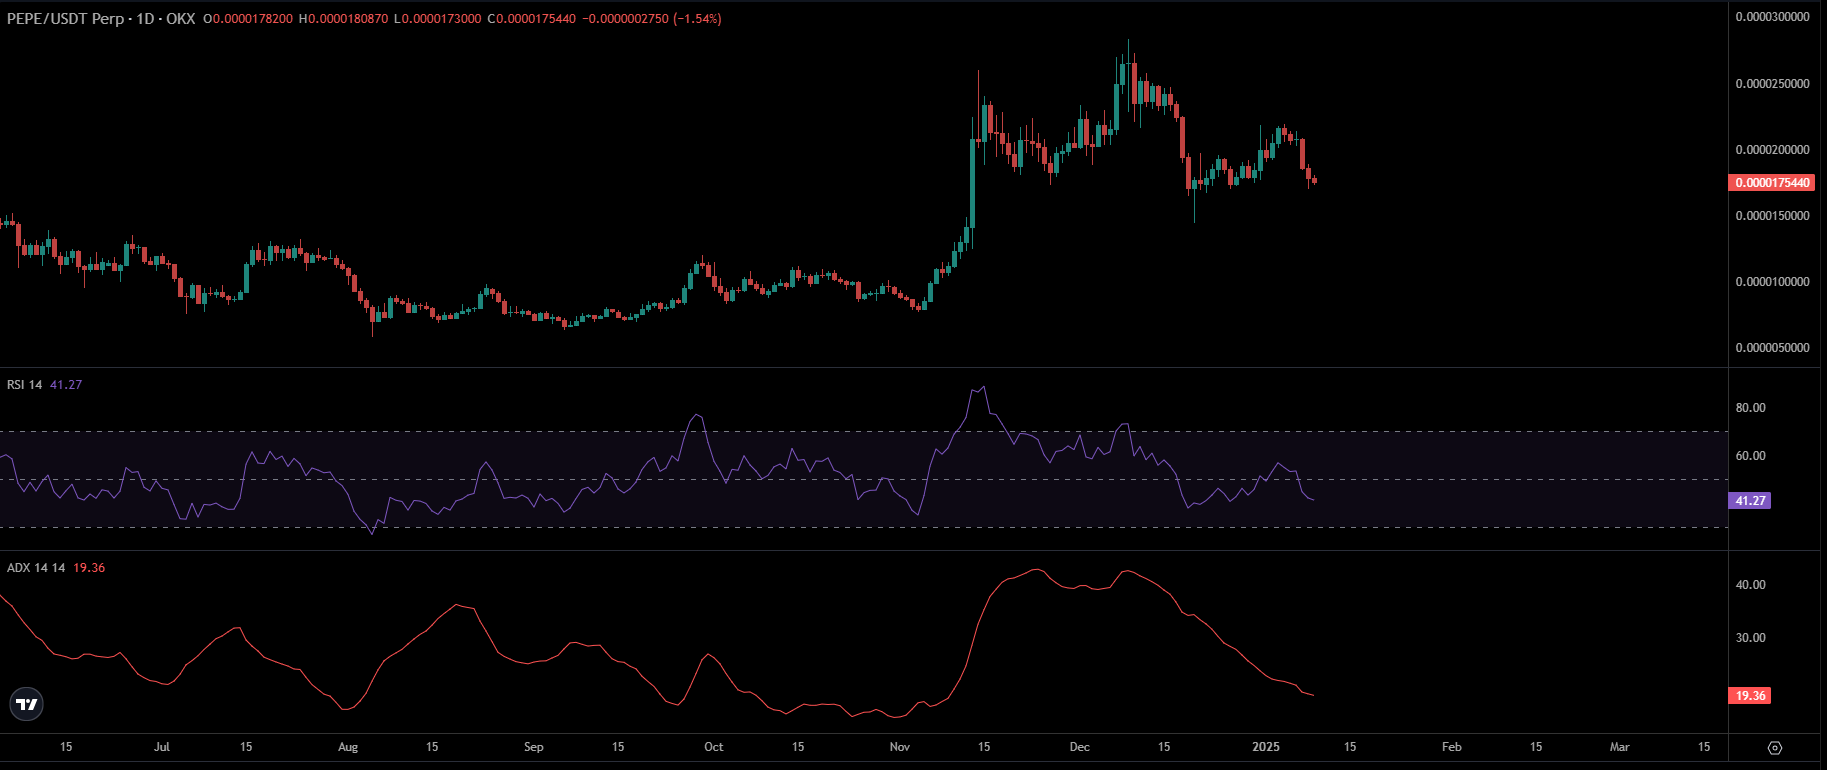
Since hitting a 52-week high mark of $0.00002835, PEPE token has been experiencing significant selling pressure. Over the past seven days, PEPE crypto price slipped by more than 10%. It has reached the crucial support zone of $0.00001700, close to the 100 day EMA mark.
The bearish market sentiment in the overall crypto market and recent whale transactions might be the reason for the recent price decline.
At press time, PEPE token price was trading at $0.00001783, noting an intraday decline of over 2.32%. Its market cap has fallen to $7.49 Billion, ranked 24th among the top crypto coins.
PEPE Token Faces Downward Pressure amid Whale Activity
The recent decline in PEPE token and increased selling pressure sparks volatility as whales continue to deposit their holdings. In the last 30 hours, a whale transferred 427 billion tokens to Kraken, valued at $8.5 Million.
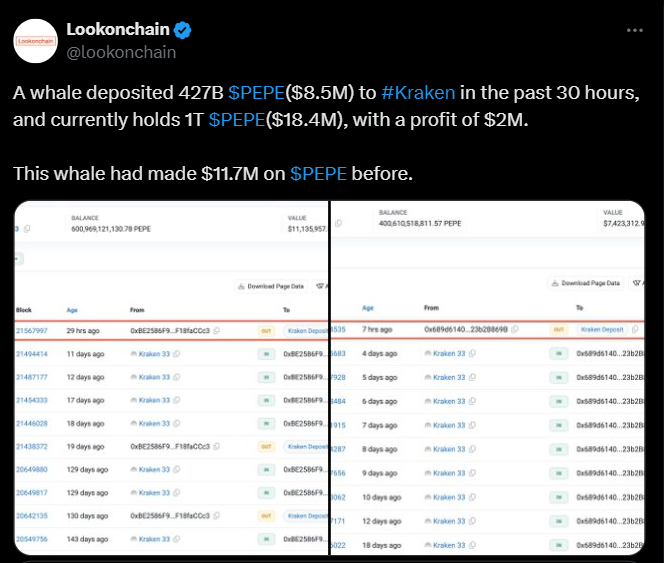
This is even after the whale has sold a large number of PEPE tokens, currently holding 1 trillion PEPE tokens, which shows the dominance. This whale has been earning from PEPE transactions, and the previous profit was $11.7 Million.
PEPE Price Prediction: Bearish Pattern Emerges
On the 4-hour timeframe, PEPE token formed a double top pattern which implies a bearish outlook, as it was known for a bearish reversal.
Also, the PEPE crypto has fallen below the 20 day EMA and 50 day EMAs, which conveys a short-term bearish outlook.
The presence of two peaks at around $0.00001950 shows that there is intense selling pressure at the resistance level.
In case of breaking below the neckline of $0.00001300, further declines could pave the way toward $0.00001000 in the coming days.
Other than the double top pattern, another bearish pattern was emerging on the daily timeframe. A bearish head and shoulders pattern was in the making which could lead to an extended downtrend.
At press time, the PEPE token was trying to hold gains around the 100 day EMA mark. Furthermore, the Relative Strength Index (RSI) was at 40, indicating selling activity, heading toward the oversold trajectory. This pointed to the potential for further decline amid multiple bearish patterns on the chart.
Additionally, the 9 day and 21 day EMA bearish crossover signals a sign of bearish momentum. Also, the ADX curve slipped below the 20 mark, conveying a declining trend.
On-Chain Data Hints at Caution
Data from IntotheBlock shows that the daily active addresses noted a significant decline of over 7%, while the new addresses dropped by 18.30%, signaling a drop in user engagement.
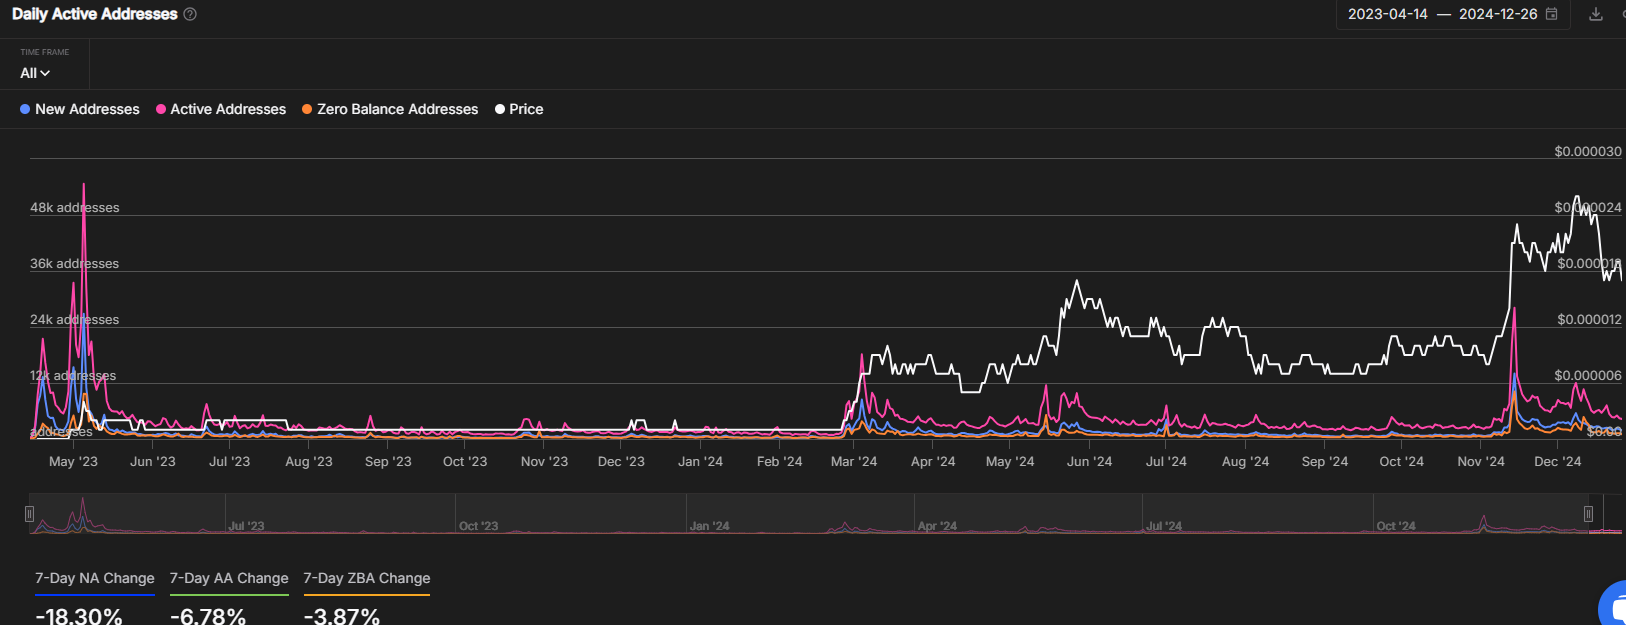
This raises questions about the waning speculative interest and could exacerbate the decline.
Furthermore, the Open Interest (OI) noted a constant decline, dropping by over 14% in the last 48 hours, implying aggressive long unwinding activity.
The immediate support zones were $0.00001500 and $0.00001300, whereas the resistance zones were $0.00002000 and $0.00002200.
Disclaimer
This article is for informational purposes only and provides no financial, investment, or other advice. The author or any people mentioned in this article are not responsible for any financial loss that may occur from investing in or trading. Please do your research before making any financial decisions.