
 Zerebro
 Bitcoin
 Aerodrome Finance
 ZKsync
 Pearl
Pearl Pudgy Penguins
 Bitway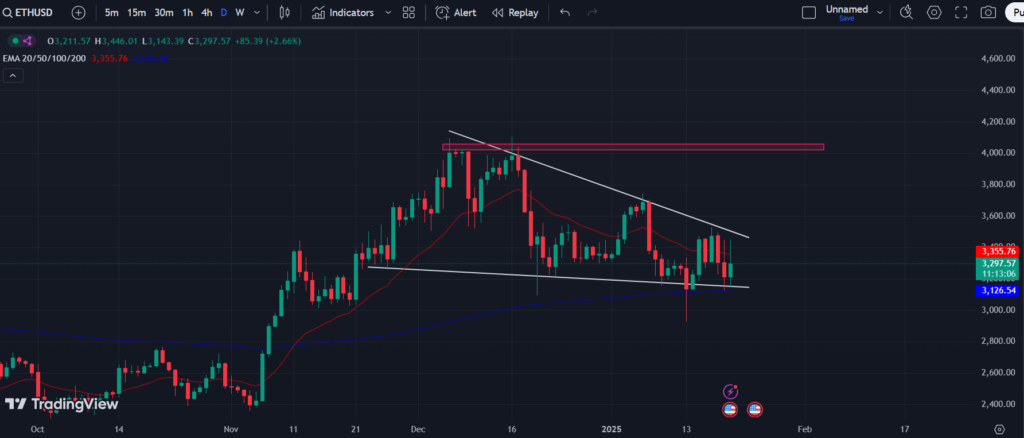
- Ethereum has received buying pressure on the 200-day EMA.
- ETH price has advanced by 4.68% in the past 24 hours.
In November, the Ethereum (ETH) price remained bullish and has touched a crucial zone of $4000. However, buyers got exhausted in this territory and preferred to book profit. This profit booking was not too aggressive so the Ethereum price kept falling slowly. Amid this bearish move, sellers lost their grip near the $3K zone. The price has been defending the 200-day EMA for the past few days and formed a double-bottom pattern.
At an average price of $3,311 per token, Trump’s World Liberty, a significant institutional player, purchased 6,041 ETH for $20 Million in USDC. This acquisition represents a commitment to Ethereum’s long-term value proposition and a vote of confidence.
The purchase, which comes as bulls appear to have taken control of Ethereum markets, shows that institutional players still view Ethereum as a strategic investment.
Firms Started Staking ETH: What’s Next?
Ethereum is rebounding from last week’s general pump and recent consolidations. Notable transactions like this and the entry of institutions into the cryptocurrency space boost market confidence and highlight the network’s significance in blockchain innovation.
According to CoinMarketCap, Ethereum has risen 5% yesterday following this institutional purchase, and it is currently trading at $3,425.43. In the meantime, the network’s market capitalization has grown to $412.77 Billion due to sustained investor interest.
In addition, Ethereum trading volume has increased by more than 31% yesterday, with $45.4 Billion being exchanged.
This rally is notable due to the overall market conditions. Following weeks of sideways trading, Ethereum’s breakout to the upside has reignited interest among institutional and retail investors. Increased trading volume, typically indicative of long-term upward momentum, is another factor supporting the rally.
ETH Price Developed a Falling Wedge Pattern
When writing, Ethereum crypto was trading at $3,304.00, it had surged 2.93% intraday. It’s market capitalization was around $400 Billion and the 24-hour trading volume was $65.78 Billion.
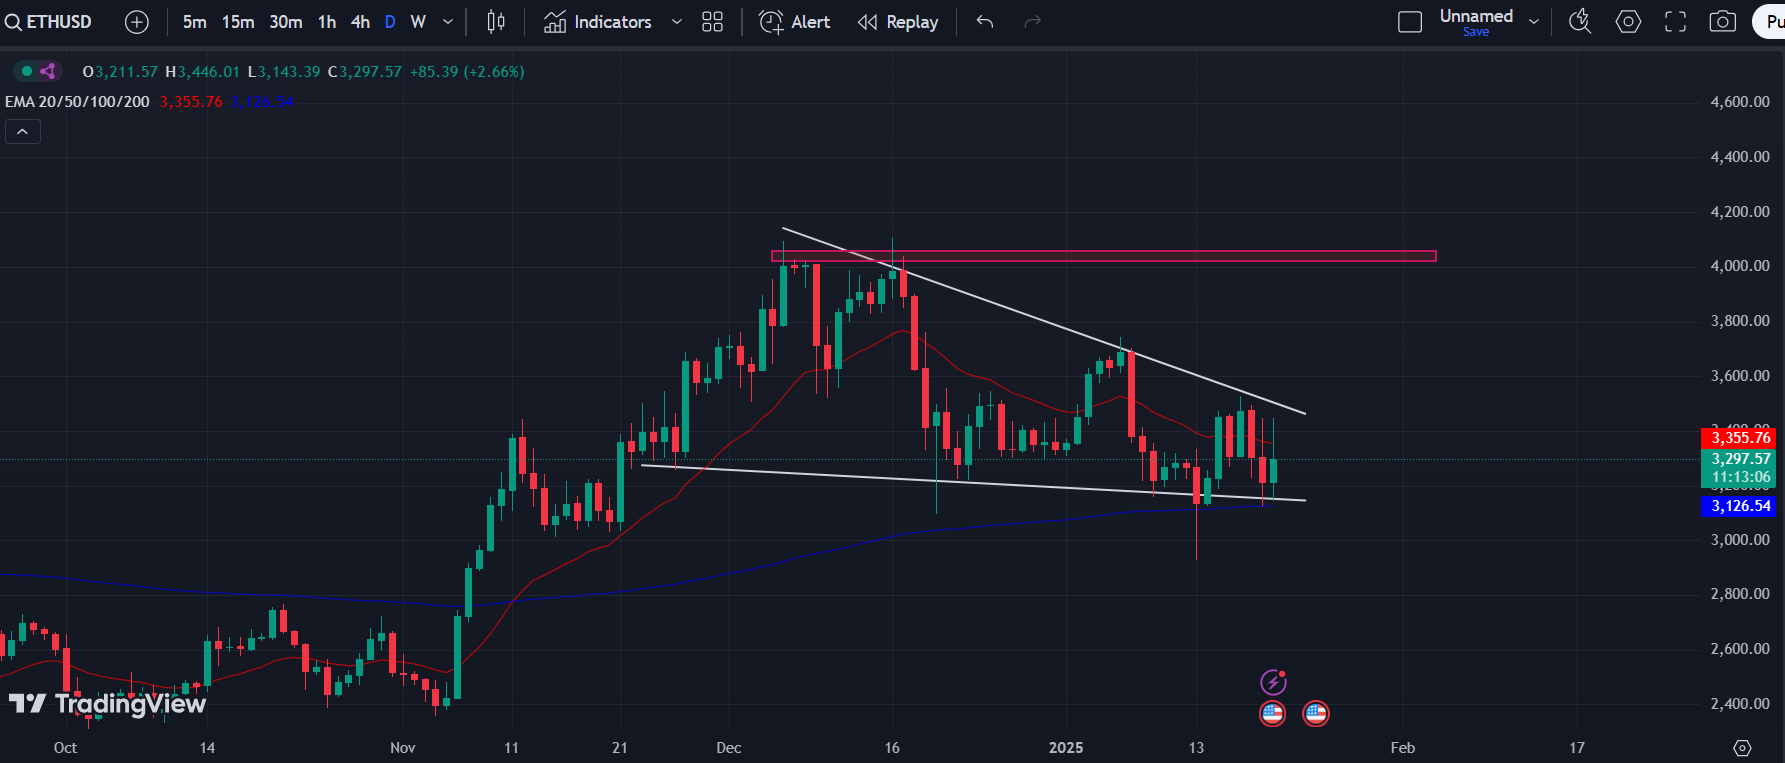
ETH price chart has formed a falling wedge pattern on a daily time frame and hovering in the breakout zone. If the price triggers a breakout from the wedge pattern, it would be a buying opportunity. If the price gains bullish momentum, it may hit the major resistance level of the $4K mark.
Conversely, if the price dives below the 200-day EMA, sellers may dominate ahead. Losing this level could attract sellers and the price may melt to the major support level of $2K.
ETH Price on the Verge of Breakout and May Shoot Up Soon
Ethereum’s recent activity indicates a potential bullish trend as institutional investments and increased trading volume contribute to renewed market confidence.
Despite facing minor profit-taking and bearish phases, the defense of key support levels, particularly the 200-day EMA, suggests resilience in the price action.
The formation of a falling wedge pattern signals a possible breakout, which could propel ETH towards the major resistance level of $4,000.
However, vigilance is necessary, as a dip below the 200-day EMA could shift momentum towards the downside, bringing the price closer to the $2,000 support level.
Disclaimer
This article is for informational purposes only and provides no financial, investment, or other advice. The author or any people mentioned in this article are not responsible for any financial loss that may occur from investing in or trading. Please do your research before making any financial decisions.




