

- COMP coin price plunged from $500 to $425 on Monday’s trading session
- The 24-hour trading volume in COMP is at $213 million
- The COMP/BTC pair was trading at 0.01251902 with a 3.3% decrease
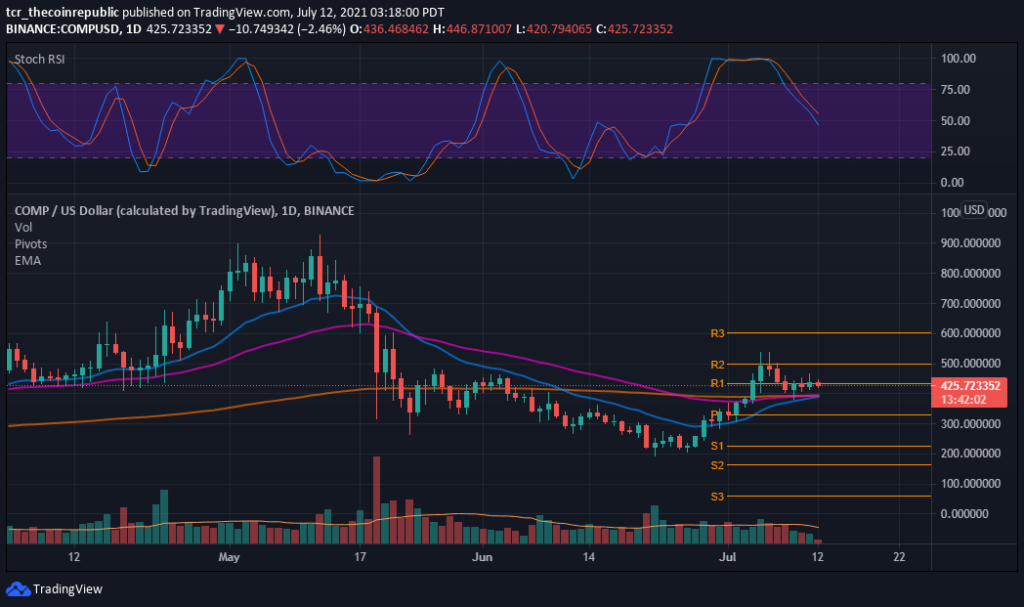
The daily technical chart of the COMP price forecasts a downtrend. According to Pivot points (FIB), COMP’s crucial support level is $433.0 & $330.0. Conversely, if it moves up, the necessary resistance level to observe is at $500. Thus, while the intraday chart forms a Bearish Harami candlestick pattern, predicting prices may soon reverse to the upside with average dependability.
The moving average (MA) composed of 50,100,200-MA can be a reliable support for currency price changes. However, investors can observe that the price moves above the orange line, ensuring an upward trend until the price stays above the MA-200.


Volume of (9.31K) is beneath the MA of 20-days (42.75K). selling pressure is too low in COMP, making its price remain in a negative zone. Investors may also observe diminishing volume bars in the chart, which indicates a big move is expected in upcoming trading sessions.
The Stochastic RSI (Bearish) with a value of K-46 D-55 exhibits a sell signal in the coin. Investors may perceive a declining slant and a negative crossover in the index. It may dwell in negative region for forthcoming trading sessions.
COMP Coin May Hit Mark of $500
COMP price traded at $426.0 with a loss of 2.8% in the last 24-hour and 4.2% down in the weekly time frame. Furthermore, COMP price plunged from the support of $433.0. In contrast, the market capitalization stands at $2.301 billion. Technically, investors can perceive the prices are above the EMA. The Stochastic RSI index showcases a downward slope. Moreover, the trend remains bearish with the overall market sentiments.
Resistance: $500
Support: $433, $330


