Minter
 Quack AI
 STONK
STONK Pons
Pons Sui
Sui Pearl
Pearl Bittensor
- SNX Price on the daily chart is about to confront the overhead resistance of $13.8
- The press time price of SNX/USDT is $13.37 established on the back of a 5% increase in the past 24 hours
- The pump from the swing low of August 18th managed to get SNX Price out of the chambers of the 200 EMA
SNX Token price action formulates a classic Double Bottom Pattern
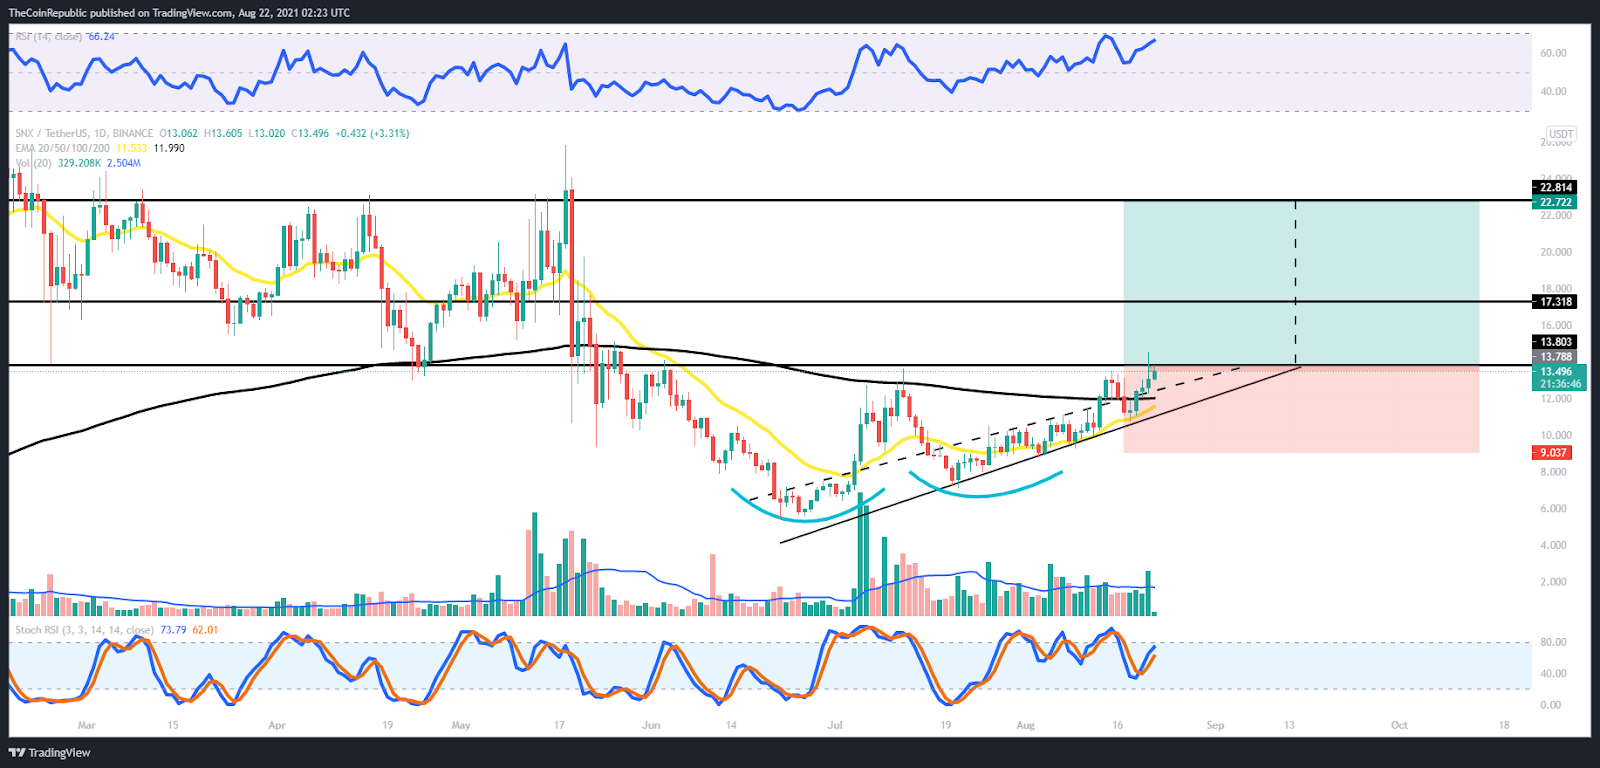
Unlike the majority of the altcoins which registered tremendous gains since the crash of July, SNX price has redefined organic growth. As evidenced by the price structure on the daily chart, the SNX token maintained its steady momentum well inside the ascending triangle pattern.
Regardless of the inability of the SNX price action to come out of the woods, the current price action still stands at an impressive elevation of 85%. The rally from low of July 20th was interrupted on multiple occasions. Regardless of that, the bulls reclaimed the support of the well-established support trend and strengthened the quality of the uptrend.
While the overall price action of the SNX token is still wrapped inside the Double Bottom Pattern on the daily chart, the confrontation of the overhead resistance always disrupts the flow. However this time, multiple catalysts are in favor of a successful break above the neckline of the bullish structure.
Reclamation of the 200 EMA support cushion is the first sign of a possibility that this breakout will awaken in an impulsive wave ahead. In addition to that, the alignment of the critical EMAs right when the price is about to challenge a crucial resistance highlights the strength of the bulls.
The calculated target from the neckline of the double bottom pattern to the low of May’s flash crash perfectly fits the minimal target of $22. The occurrence of this scenario will validate a 63% upswing from the point of breakout.
On the daily chart, the RSI is about to oppose this week’s rally by entering the overbought territory. A breach of the 70 mark will attract a new set of buyers who will follow the lead and attempt to break above the neckline.
On the contrary, the daily stochastic RSI amid formulating a minor case of bearish divergence. For the day ahead, a rejection from the overhead resistance will simply lead to a retest of the swing support trend line, which is also bolstered by the 200-period exponential moving average. This outlook will delay the bullish perspective and generate an accumulation phase.
SUPPORT : $12.2
RESISTANCE : $13.8