

- KSM coin bears reclaimed the 200-day EMA
- The KSM/BTC pair was trading at 0.007298 BTC with a gain of 3.98%
- The 24hr trading volume in KSM coin is $534.2 Million
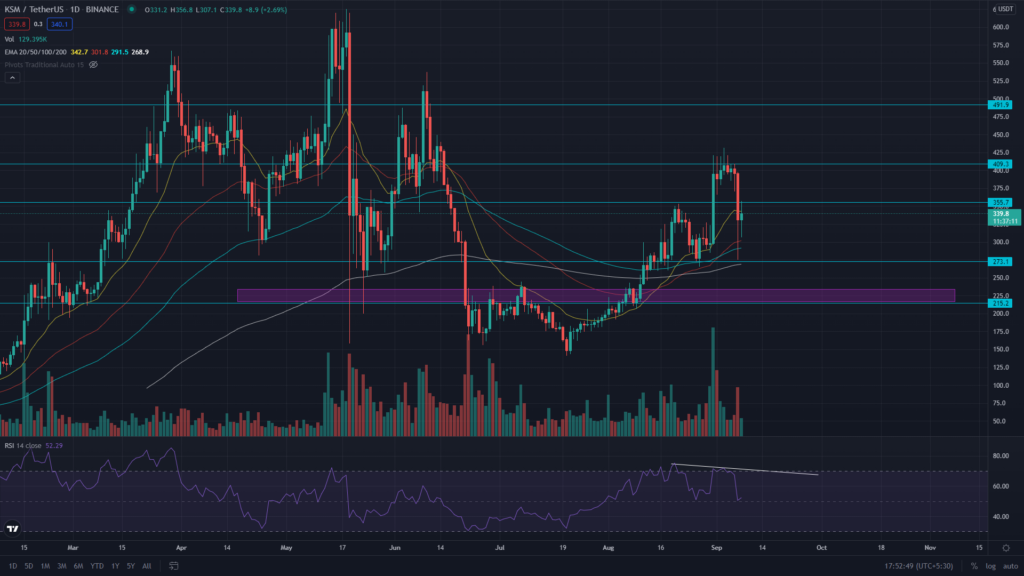
For almost one week, the KSM coin was struggling to cross above the $410 resistance, showing multiple Doji-type candles at that level. However, yesterday when nearly the entire crypto market was under intense selling pressure, the KMS bears got enough to boast of dropping this coin to its lower levels. The price has currently given a breakdown from the $355 support, and it is now going through a retest phase to validate this breakdown.
Concerning the EMAs, the KSM coin shows a bullish trend as the price trading is above the crucial EMAs 50, 100, and 200. However, the coin price has dropped below the 20 EMA line


The RSI (BULLISH) value is at 52, indicating the bullish sentiment is intact for the KSM coin. However, the RSI line shows a slight bearish divergence concerning the price action, suggesting the bulls are losing their momentum.
KSM Coin price respects the level of an ascending trendline
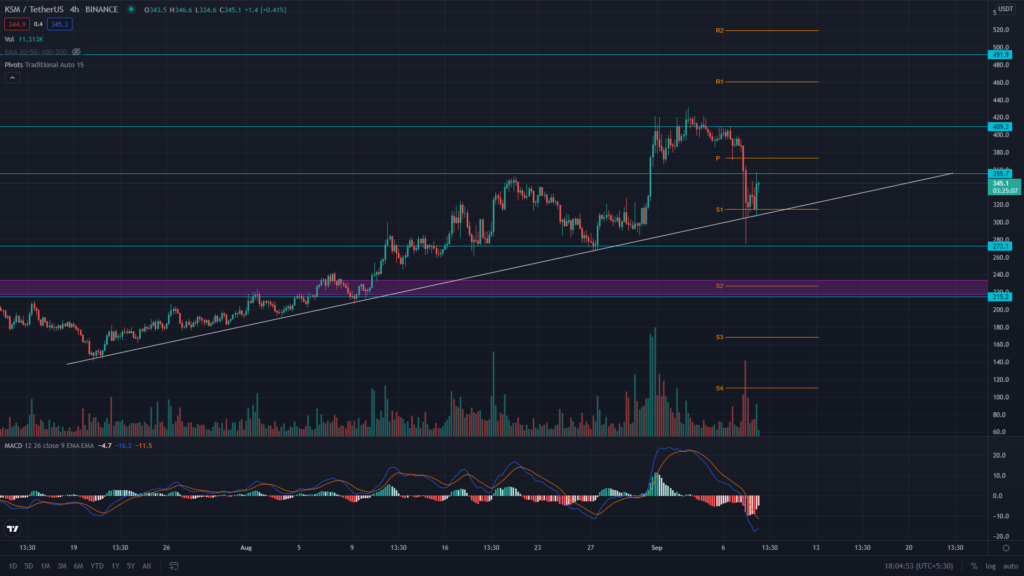
The KSM coin shows a highly reliable trendline in its chart, providing good support for its price. Even though the price displayed a 15% drop in its value yesterday, the candle still managed to close above the support trendline keeping the trendline intact. Anyhow, the traders can still wait for the price to at least break out from its nearest resistance to confirm its rally.
The MACD indicator (BEARISH) shows both the MACD and signal lines are moving below the neutral zone(0.00), indicating a strong bearish momentum in its price.
Conclusion: From a technical perspective, the overall trend of the KSM coin is still bullish and will remain so until its trendline remains intact. However, the KSM traders should wait for the price to settle down from this chaotic phase and display a proper signal on which side the coin wants to charge its rally.
Support– $273
Resistance- $355


