

- RVN coin price trying to sustain above the 200-day EMA
- The RVN/BTC pair was trading at 0.000001094 BTC with a gain of 2.94%
- The 24hr trading volume in RVN coin is $47.1 Million, indicating a 1.47% loss
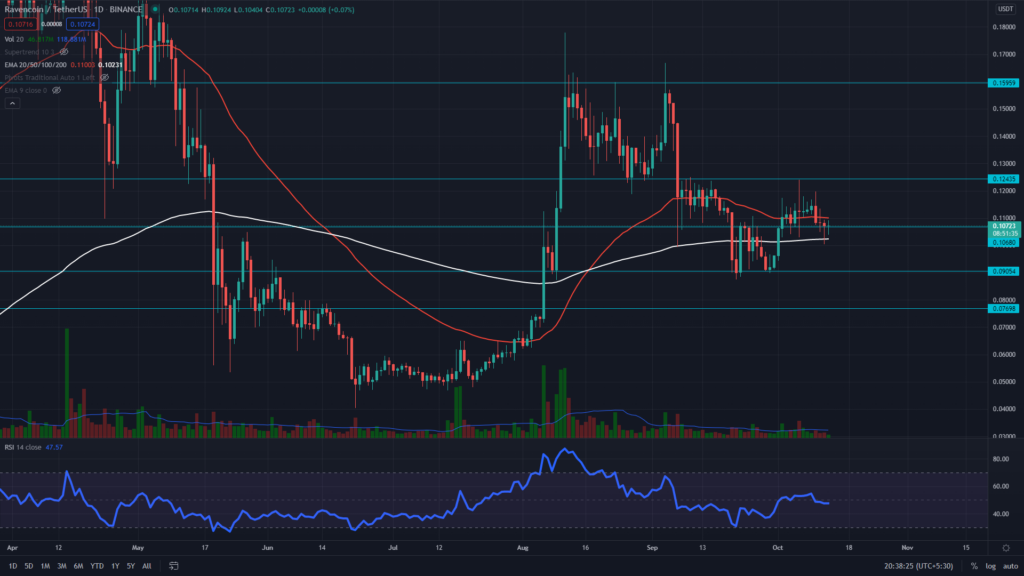
The RVN coin had recently bounced from the $0.905 support, with a double bottom pattern. The bullish pattern helped the price to rally to the $0.12 mark. However, the intense selling pressure at this level immediately plunged this coin to the nearest support of $0.106. The coin price is still trying to sustain above this level, displaying a long tail hammer candle pattern.
According to the EMAs, the RVN coin still indicates a bullish trend as the price is trading above the crucial 200 EMA. However, the 50 EMA is also quite near to the price and can act as a good resistance.


The RSI (BULLISH) value is at 47, indicating a bearish sentiment in the coin. However, the RSI has shown impressive growth concerning the coin’s price action.
RVN Coin Indicates A Possibility Of An Inverted Head And Shoulder Pattern
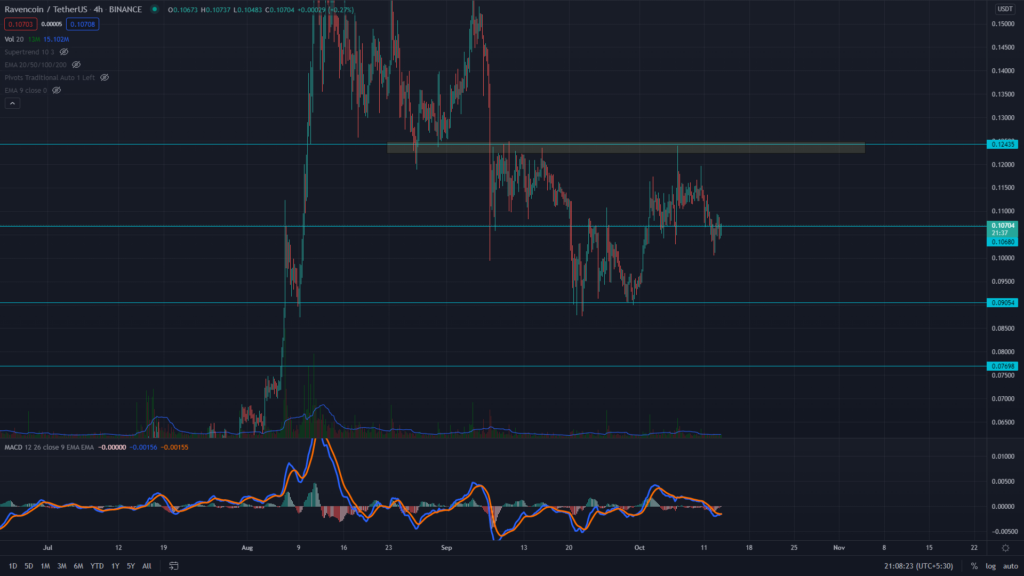
As mentioned above, the RVN coin is experiencing good support from $0.106, and if the price manages to bounce from this level, the technical chart shows a reasonable chance of an inverted head and shoulder pattern. The crucial resistance or the neckline for his pattern is at the $0.124 mark.
The MACD indicator (BULLISH) shows that both the MACD and signal lines are moving below the neutral zone(0.00), indicating bearish momentum in the price.
Conclusion: From the technical perspective, the short-term for the RVN coin is still bearish. However, the chart has started showing some positive signs for the buyers, just like this inverted head and shoulder pattern. The crypto traders can grab an excellent long opportunity for them once the price gives a proper breakout from the $0.124 resistance.
Support– $0.106
Resistance– $0.124


