Boomer
 Covenant x402
 Pearl
Pearl Claudia
 Solana
 Bitcoin
 Quantus
- The trading volume of the Sushi token in the last 24-hours at the time of writing this article was +1.6
- The price of SUSHI/BTC and SUSHI/ETH at the time of writing this article is 0.000183 BTC and 0.002598 ETH, respectively
- 20MA is below the 100MA
LONG TERM VIEW:-
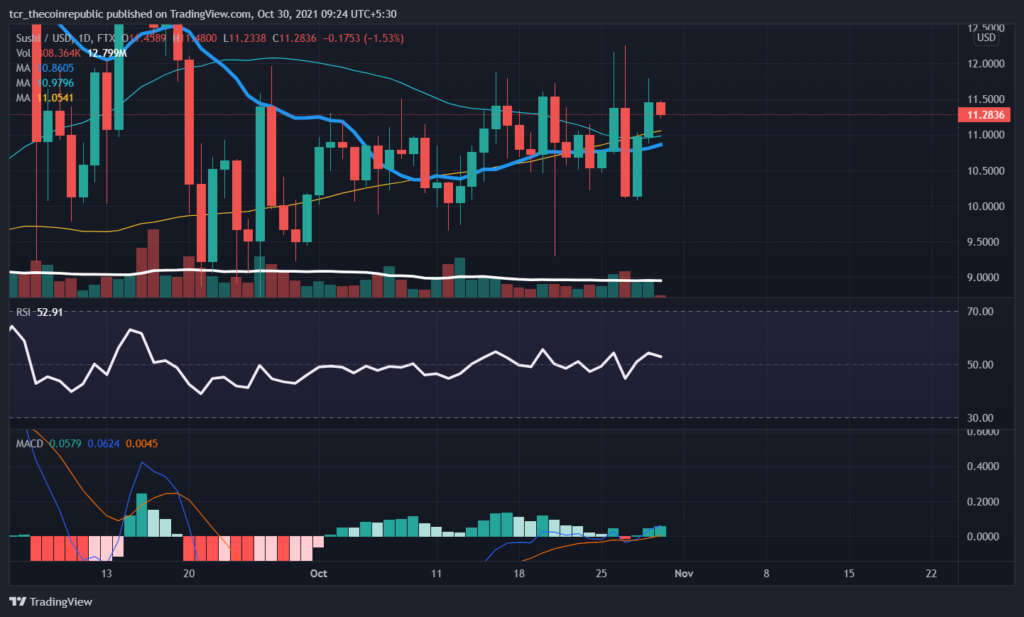
In the daily time interval, we can see the price is near the resistance as the bulls are trying their best to break it, and the bears are trying their best to push them down. As the 20MA is below the 100MA and that’s a bearish move. Let’s look at the technical indicator to see if the price will break the resistance or not.
First, we can see the MACD, which is showing green histograms as the MACD line is above the signal line. Also, there is no sign that lines will change their direction. In addition to that, we can see the RSI is in the neutral zone near 53, and the RSI line is pointing sideways, which means that the bulls and bears are giving each other a good fight.
Lastly, we can see the Moving average as the 20MA is below the 50MA and 100MA. Also the 50MA is below the 100MA, which is a bearish sign.
SHORT TERM VIEW:-
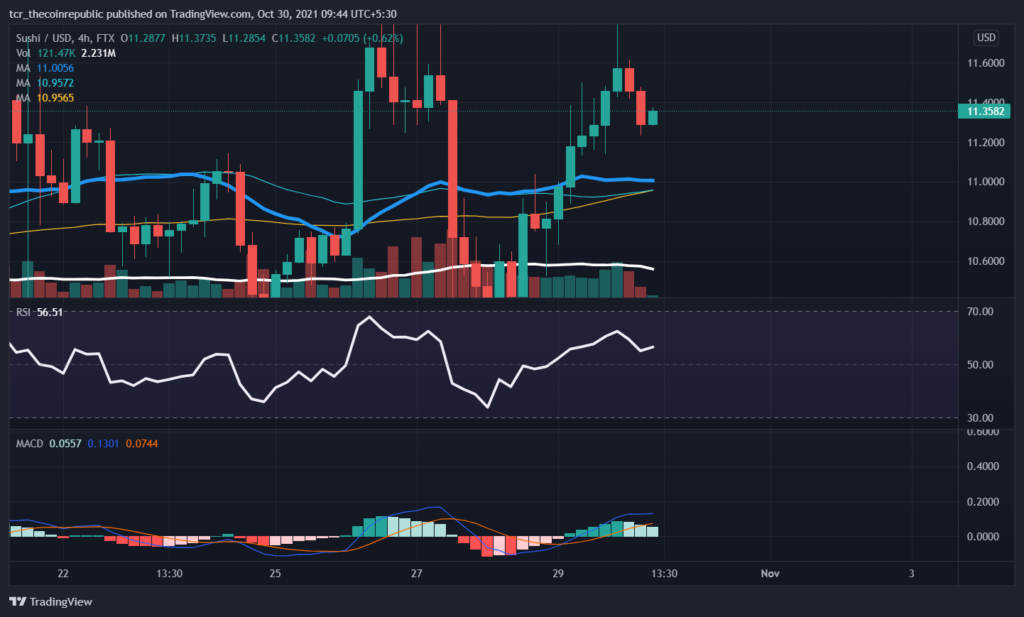
In the 4-hour time interval, we can see the 20MA is above the 50MA. Also, the MACD is showing green histograms, which means the MACD line is above the signal line, but the MACD line is changing its direction, which means it will cross the signal line soon, which is a sell signal.
In addition to that, the RSI is in the neutral zone near 54, and it is pointing towards the overbought zone of 70, which means the bulls are winning the fight against the bears. Lastly, we can see the moving average as the 20MA is below 50MA and the 100MA is crossing the 50MA in an upward direction which is a bearish sign.
CONCLUSION:-
Looking at both the long term and short term, price is near the resistance in the daily chart and near the support in the 4-hour, the price may break the resistance as in the 4-hour time interval we can see the RSI is pointing the bulls are winning the fight so the trend might go bullish if the bulls keep the same amount of pressure on the bears.
They might break the resistance but the chances are low to maintain this amount of pressure as the price will go near the resistance the bears will increase the amount of pressure on the bulls
RESISTANCE:-$12.01,$12.80
SUPPORT:- $10.70,$10.07