The Market Periodical
  • Home
  • Markets
  • Opinion
  • Cryptocurrency
  • Blog
Contact Us

bonafides

  • Login
The Market Periodical
  • Home
  • Markets
  • Opinion
  • Cryptocurrency
  • Blog
Contact Us

bonafides

The Market Periodical

bonafides

Home News

NEO Price Analysis: Coin is Accumulating it Can Breakout Soon

Nikhil Ingole by Nikhil Ingole
October 31, 2021
in News
0
NEO Price Analysis: Triangle Formation of NEO Token Price Poses Bearish Fallout Threats
1.5k
SHARES
11.9k
VIEWS
Share on FacebookShare on Twitter
  • The NEO coin price struggles below the 55-EMA during intraday
  • The 24-hour trading volume is at $268 million.
  • NEO/BTC pair is trading positive by 2.7% at 0.00071215 BTC.
Source: NEO/USDT on TradingView

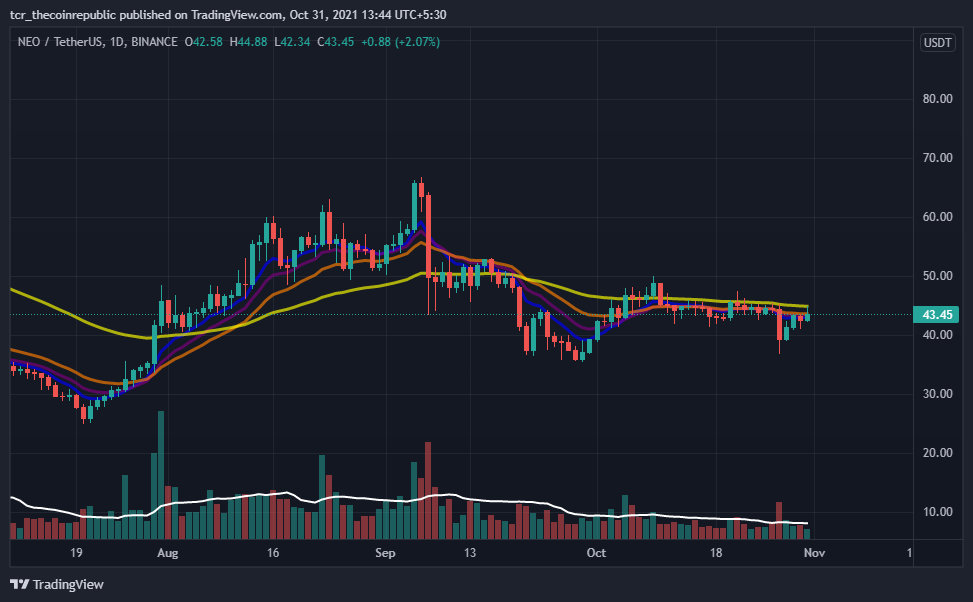
On the daily price chart of the NEO coin, The Moving Average (EMA), which includes the 8,13,21,55 EMA, acts as reliable support for currency price movements. Investors may notice price moves below the yellow line, ensuring a NEO downtrend until the price resides below the EMA’s.

Trading volume (249.247 K) is close to the 20-day moving average (391.689 K). The volume is high and increasing, so the cost is moving upside. Investors may also notice a decrease in volume. This indicates that unusual fluctuations are standard on the following trading days.

Related articles

XTZ Price Analysis: Candles resisting at $3.000(may sink further) to breakout soon.

Tezos price analysis: The bulls struggle near the crucial $2.0 level during recovery

May 25, 2022
FTM Price Analysis

FTM Price Analysis: Will rising bullishness mark a turning point for Fantom? 

May 25, 2022

NEO Coin Pullbacks From The Support Zone 

Source: NEO/USDT on TradingView

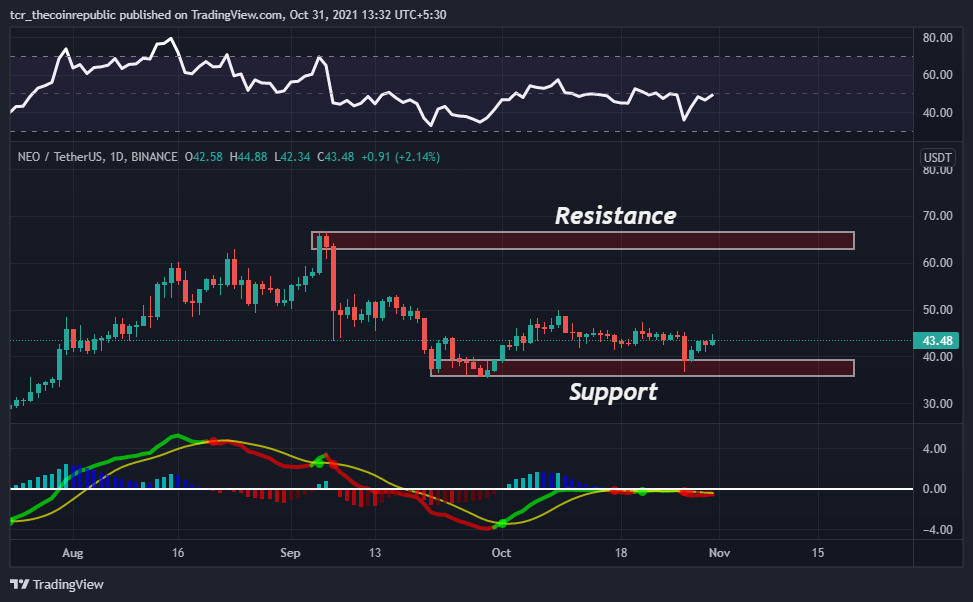
NEO coin daily price charts show an uptrend. Based on the price action, the support range is $35 – $40. On the flip side, the resistance area you should be looking for is $60 – $65.Therefore, the chart shows a bullish harami candlestick pattern during the day.

The RSI showed a 49 (neutral) signal, Expecting to be flat in the short term. Investors may find that the RSI line is lying flat on the indicator. It may arise in the coming trading days.

The MACD shows a (bearish) cross below the signal line on October 27th, indicating a sell signal for the currency. In addition, investors can see the end of red bars in the histogram indicator.

Conclusion

NEO is currently trading at $43.77 on a 24-hour trading volume of $268,308,032. NEO coin prices have increased 2.2% in the past 24 hours. There are 71 million NEO coins in circulation, for a total of 100 million coins.

RSI shows a neutral, and MACD indicates a sell signal. Traders have directed high volume. In fact, the cost has bounced from the support zone. A market overview also shows that this pattern will continue to rise in the coming trading days.

Resistance Level: $60- $65

Support Level: $35- $40

Share618Tweet387
Nikhil Ingole

Nikhil Ingole

Mr, Nikhil Ingole is a Cheif Editor at TheMarketPeriodical with over seven years of technical analysis & trading experience in Forex and Indian stock market. As a commerce graduate, he has taken a keen interest in blockchain's future potentials in the financial industry. He possesses strong technical, analytical skills and is well known for his financial market's informative analysis. Other than crypto, Nikhil Loves to watch his favorite football team and keep up to date with the latest Formula 1 racing.

Related Posts

XTZ Price Analysis: Candles resisting at $3.000(may sink further) to breakout soon.

Tezos price analysis: The bulls struggle near the crucial $2.0 level during recovery

by Nancy J. Allen
May 25, 2022
0

Tezos (TRX) looks bullish after retreating from its monthly low with gains of over 40% so far.Last night, the bulls...

FTM Price Analysis

FTM Price Analysis: Will rising bullishness mark a turning point for Fantom? 

by Antonio K Smith
May 25, 2022
0

•FTM/USD is currently priced at $0.41 and has decreased by 1.26% over the past day •The technical indicators suggest a...

Bitcoin Cash Price Analysis

Bitcoin Cash Price Analysis: BCH Coin Stuck Inside a Horizontal Range-Bound Area, What’s Next?

by Nancy J. Allen
May 25, 2022
0

Bitcoin Cash price is trading inside a range bound area over the daily chart.The crypto asset is trading below 20,...

Polygon Price Analysis

Polygon Price Analysis: MATIC Trading In a Falling Wedge, What’s the Escape Plan?

by Ritika Sharma
May 25, 2022
0

Polygon price is declining through a falling wedge pattern over the daily chart.The crypto asset is trading below 20, 50,...

NEO Price Analysis

NEO Price Analysis: NEO Recovered Around 7% This Week, But Most Recent Resistance Creates Trouble

by Antonio K Smith
May 25, 2022
0

NEO investors are managing the altcoin price well above the $10 conceptual round level in the intraday trading session.The 20-day...

Load More
  • Trending
  • Comments
  • Latest
charged-particle-backdrop

Charged Particles Helps in Making the Future of Nextgen NFTs

May 13, 2021
Powerledger

Powerledger is revolutionizing the world of energy

January 31, 2022
ETH

Ethereum Analysis: Ethereum Hits A New All-Time High of $1467; ETH On Longspan Bull Rally?

January 28, 2021
Tron Price Analysis: The Tron Voin Showcased an Attempt To Break Out From The $0.083 Mark

TRON (TRX) Analysis: Is TRON going to continue its Bullish Rally?

October 30, 2021
XTZ Price Analysis: Candles resisting at $3.000(may sink further) to breakout soon.

Tezos price analysis: The bulls struggle near the crucial $2.0 level during recovery

0
Bitfinex

Bitfinex Lets Users Earn on their Bitcoin with Celsius

0
Binance Burned the Highest Number of BNB Tokens Till Day Worth $68 Million

Binance Burned the Highest Number of BNB Tokens Till Day Worth $68 Million

0
Cryptocurrency

U.S. Congress Members Have Introduced 40 Bills on the Subject of Cryptocurrencies

0
XTZ Price Analysis: Candles resisting at $3.000(may sink further) to breakout soon.

Tezos price analysis: The bulls struggle near the crucial $2.0 level during recovery

May 25, 2022
FTM Price Analysis

FTM Price Analysis: Will rising bullishness mark a turning point for Fantom? 

May 25, 2022
Bitcoin Cash Price Analysis

Bitcoin Cash Price Analysis: BCH Coin Stuck Inside a Horizontal Range-Bound Area, What’s Next?

May 25, 2022
Polygon Price Analysis

Polygon Price Analysis: MATIC Trading In a Falling Wedge, What’s the Escape Plan?

May 25, 2022
  • Home
  • Contact Us
  • SUBMIT PR

© 2022 The Market Periodical

 
No Result
View All Result
  • Home
  • Markets
  • Opinion
  • Cryptocurrency
  • Blog
  • Contact Us

© 2018 JNews by Jegtheme.

Welcome Back!

Sign In with Google
OR

Login to your account below

Forgotten Password?

Create New Account!

Sign Up with Google
OR

Fill the forms below to register

All fields are required. Log In

Retrieve your password

Please enter your username or email address to reset your password.

Log In
Are you sure want to unlock this post?
Unlock left : 0
Are you sure want to cancel subscription?