
 Boomer
 Covenant x402
 Claudia
 Pearl
Pearl Quantus
 Bitcoin
 NEAR Protocol
- The Miota price seems to be sideways, just above the demand zone (green) after breaking out of the intense consolidation phase.
- The IOTA coin price is retesting the lower verge of the Bollinger bands indicator below the 20-day moving average (blue).
- The IOTA/BTC pair price is training positive by 1.3% at 0.00002057 satoshis.
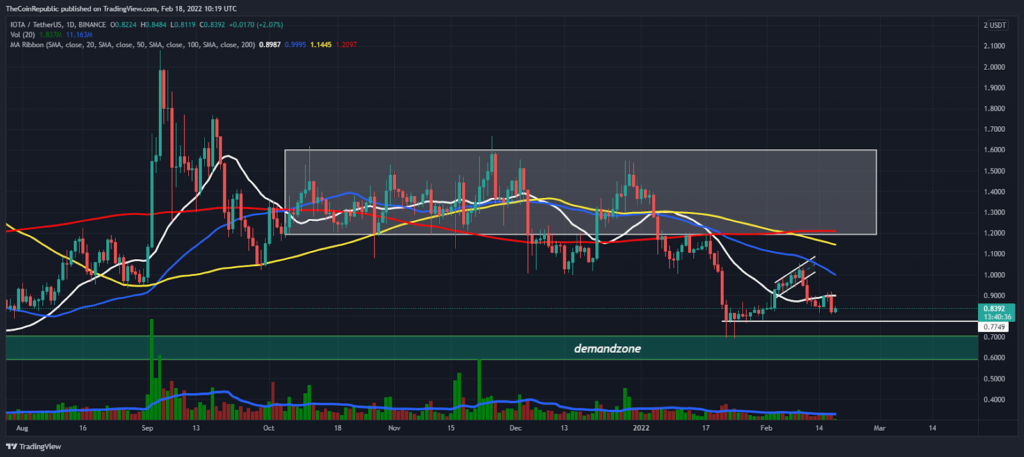
IOTA coin price fluctuated in a broad range for over four months before breaking the psychological level of $1.0. After breaking the $1 level, the coin price showed a sharp sell-off and lost 30% of its cost till the demand zone. The coin consolidated in the short-range and returned to the ascending parallel channel. But again, the bears dumped the price below this upward channel, which resulted in the IOTA coin price moving above the critical demand zone.
At the time of writing, MIOTA coin price is training in the green zone by 2.37% at $0.841 after the sharp sell-off red candle. However, the crypto price has been consolidating between $0.8100-support and $0.900-resistance for less than a week; buyers are preparing for the rapid bullish momentum because they have an excellent chance to change the previous trend.
The IOTA coin price has been training below the 20-day moving average since 12 February in terms of the daily price chart. On the other hand, 50,100 and 200 MAs are still above the current price. However, the IOTA has lost 14% of trading volume over the past 24-hours. The volume to market capitalization ratio is 0.1217.
Bulls are looking to reach psychological level of $1.0
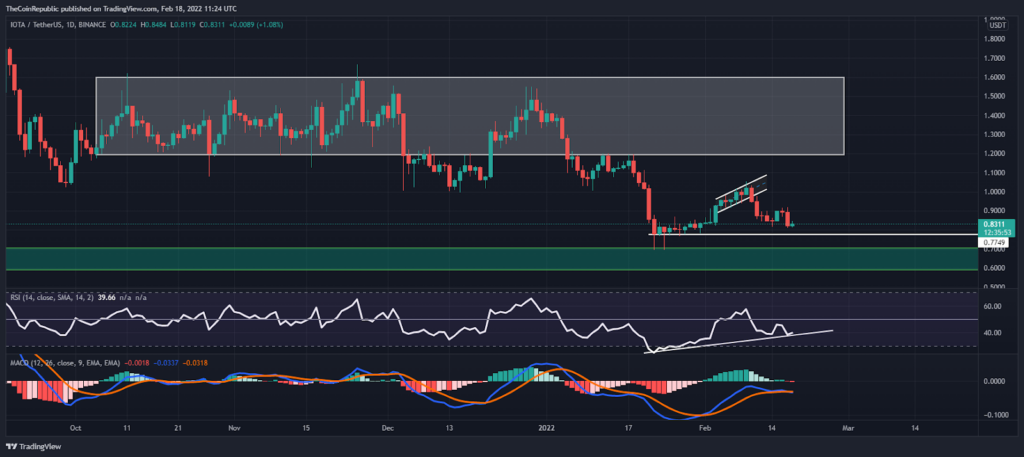
The RSI is moving below the 50-mark in terms of the daily price chart. At the time, the RSI retests the upwards trendline (white). If bulls fail to hold the price above short-term support at $0.775, RSI slips below the trendline and may attract bears for selling. However, the MACD seems to be flat just below the neutral level, and the Histogram makes lower lows.
Conclusion
A lack of immediate buyer action will likely cause the downtrend to continue, and sellers might be aggressive below the demand zone.
Support level- $0.775 and $0.60
Resistance level- $1.0 and $1.5
Disclaimer
The views and opinions stated by the author, or any people named in this article, are for informational ideas only, and they do not establish financial, investment, or other advice. Investing in or trading crypto assets comes with a risk of financial loss.




