
 Quack AI
 NEAR Protocol
 Monero
 Lighter
 Ethena
 Pons
Pons Sui
Sui
- KDA token price is trading in a very small range after facing continuous rejection of the green trendline and currently it is trading at $6.1105.
- KDA token price is forming a symmetrical triangle pattern on a daily time frame.
- The pair of KDA/BTC is trading at 0.0001524 with an increase of 0.85 % in the market cap of the digital asset over the past 24 hours.
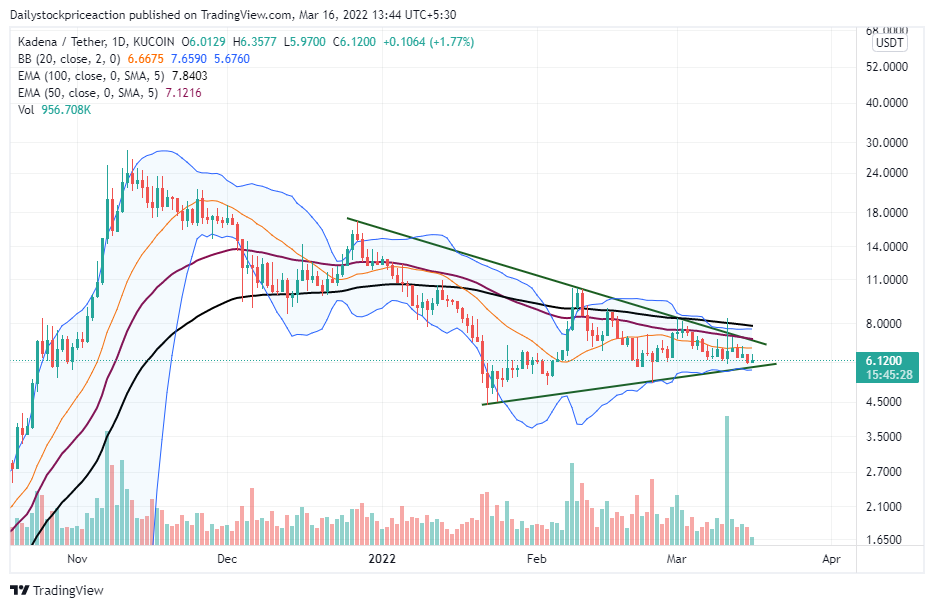
KDA Token price is in a strong downtrend after breaking down the long-term demand zone and turning the supply zone at $10.5. There seems no hope for recovery in the Token as it again failed to surpass the important supply zone of $10.5. The Token has started forming lower low and lower thigh formation on a daily time frame. The Token fell after facing rejection at 50 and 100 EMA, and currently, it is trading below the vital 50 and 100 EMA. KDA token price is currently below 20 EMA after the fake breakout of 50 EMA.
The Token is trading in the middle of the Bollinger band indicator after failing to surpass the upper band of the Bollinger band indicator. KDA token recently broke down the important demand zone, and after doing a retest at the short-term demand zone of $10.5, it has started falling again. Investors should be cautious and not take a long position until the $10.5 price level is not broken. Volumes have increased over the last trading days, causing volatility to increase, and thus investors should wait until the price settles and then take trades.
ADX and RSI are showing bullish signs on daily time frame
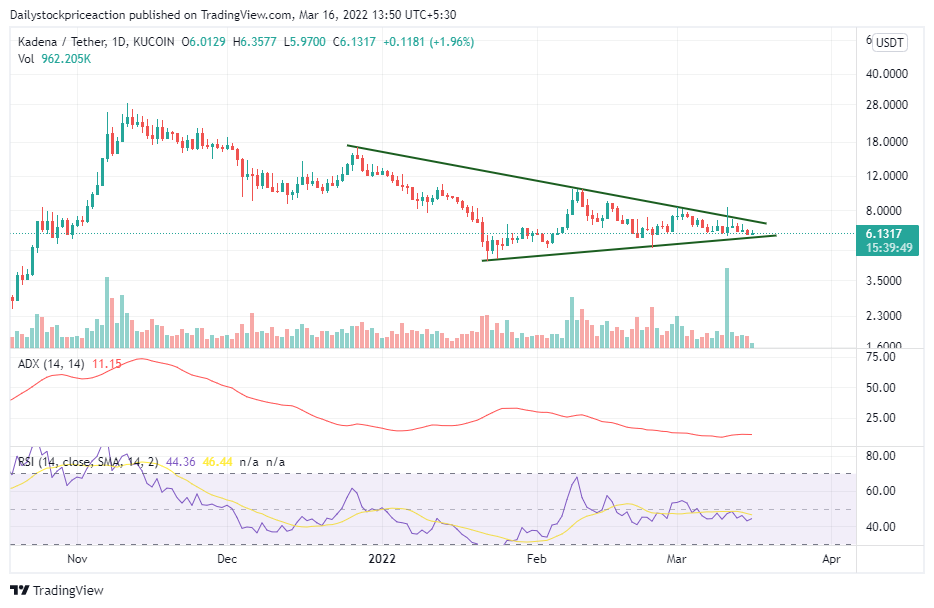
KDA token price, as per the technical parameters, is bullish as the token price is trading in a very narrow range, indicating a breakout on the upside.
Relative Strength Indicator: RSI is trading at 44.36, and recently the RSI Curve has given a negative crossover of 20 SMA. RSI Curve has fallen below the halfway mark of 50. The trend is bearish as of now, and it will continue until the Token crosses the price of $10.5 on the upside and changes the price structure,which can lead to change in the trend of the token.
Average Directional Movement Index: ADX dipped below 30 as Token’s price fell. After the retest of the supply zone, the Token started falling again, and the ADX curve is depicting the same.ADX curve has turned upwards, indicating a strong bullish movement for the upcoming trading days if the bulls sustain and continue to support the price
KDA token is forming symmetrical triangle pattern on daily time frame
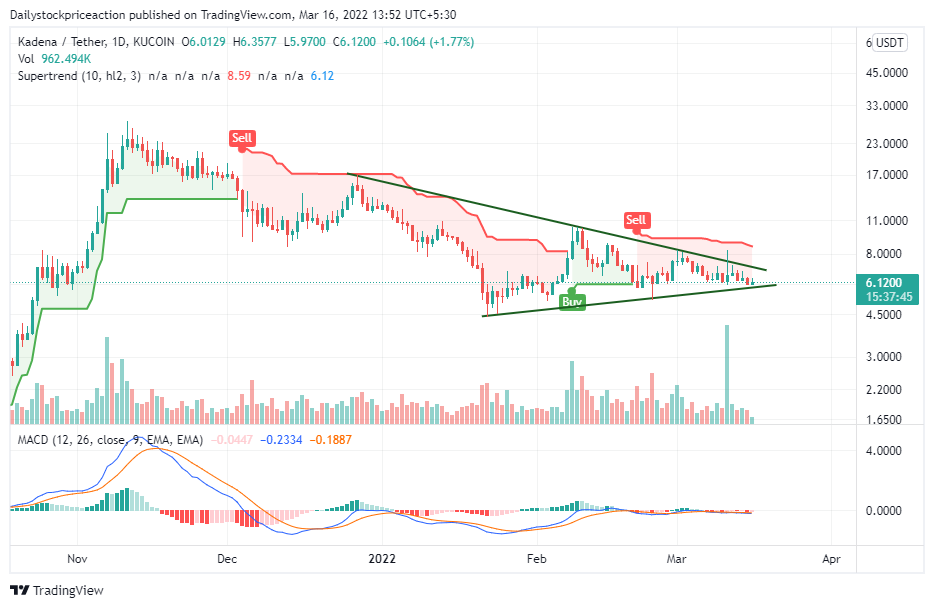
KDA token price, as per the price action is forming symmetrical triangle as the token price managed to stay above the previous low. As a result, the token price has started trading in a small range and is at the end of the triangle indicating a possible breakout on either side and the momentum to continue on the breakout side.
Supertrend: Recent bearishness in the overall cryptocurrency market has affected the price of the KDA token, and as a result it led to Supertrend indicator’s breakout at $5.91, and the supertrend gave a sell signal. The Token is currently trading below the supertrend line, acting as resistance. If the token faces rejection of the super trend trendline, there can be a bearish movement in the digital asset price. If the Token can push higher and break out of the supertrend sell red line, then the indicator can be seen turning bullish and giving a buy signal, after which investors can trade accordingly.
Moving Average Convergence Divergence (Bullish): MACD indicates a bearish trend on the daily time frame, giving a negative crossover. The seller’s signal line (orange) crossed the buyer’s signal line(blue) on the downside, indicating a possible breakdown of the long-term demand zone at $5.5, which can trample the price down to the demand zone of $2.3 with momentum, but investor should remain cautious until the trend is confirmed with breakout and retest on either side movement.
Conclusion
KDA token price, as per the price action is at make or break level as it is forming symmetrical triangle.The technical parameters are suggesting the same.Therefore, the investors should remain cautious until the token price breaks out on either side and decides the trend.
SUPPORT: $5.5 and $4.9
RESISTANCE: $10.46 and $9.9
Disclaimer
The views and opinions stated by the author, or any people named in this article, are for informational ideas only, and they do not establish the financial, investment, or other advice. Investing in or trading crypto assets comes with a risk of financial loss.




