
 Minter
 Quack AI
 STONK
STONK Pons
Pons Sui
Sui Pearl
Pearl Bittensor
- Helium coin is growing rapidly nowadays, and the price action of crypto gives a double bottom chart pattern.
- The key support area for the HNT coin is $20, where the bulls have been barely managing a cost above it since late January.
- HNT holders are approaching the Red indication line of the Super Trend indicator in terms of the daily price chart.
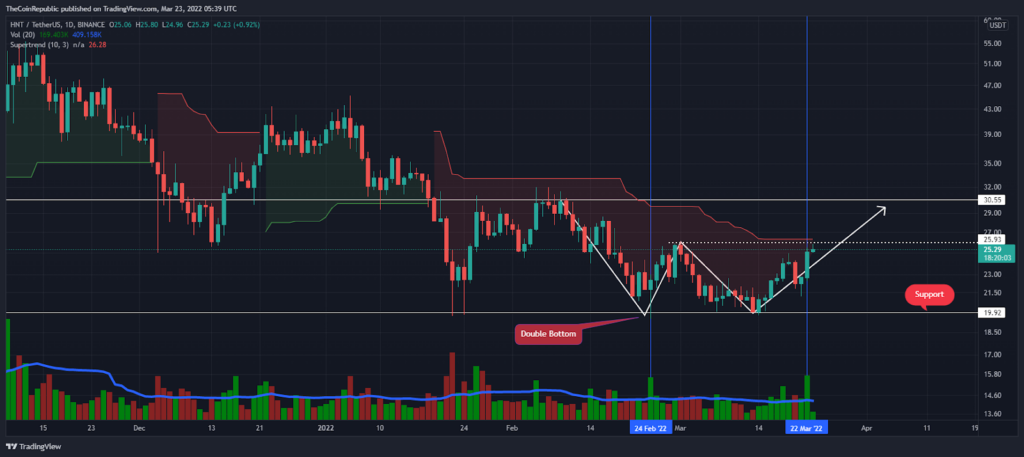
2021 was a great year for Helium, with long-term holders celebrating an increase in their investments. In the year of 2021, the bulls saw a rally from $1.35 to $59.2 (an all-time high), giving them an ROI of around 4440%. On the other hand, since the ATH mark bears have been dominating the HNT coin and following the selling on rise technique; therefore, the price action of an asset shows the lower-higher and lower-lows formation.
The Helium coin has been consolidating in a broader horizontal range over the past several weeks, where sellers hold $30-key resistance and bulls barely manage a price above $20. Thus, HNT Coin is reflecting double top formation near critical support, resulting in a 6.7% rally in trade, at $25.31 at the time of writing. Similarly, the HNT/BTC pair price is trading inclined by 8.9% at 0.0006026 Satoshis.
As per the Super Trend indicator, HNT price is approaching the red indication line (as well as the neckline of the double bottom pattern) in terms of the daily price chart. Perhaps the bulls could face a pull-down near the $25 level. However, the coin has seen a 70% increase in trading volume over the past 24 hours during the bull run. Meanwhile, the volume to market capitalization ratio is 0.02759.
Is it a good time to buy HNT near the neckline of the double bottom formation?
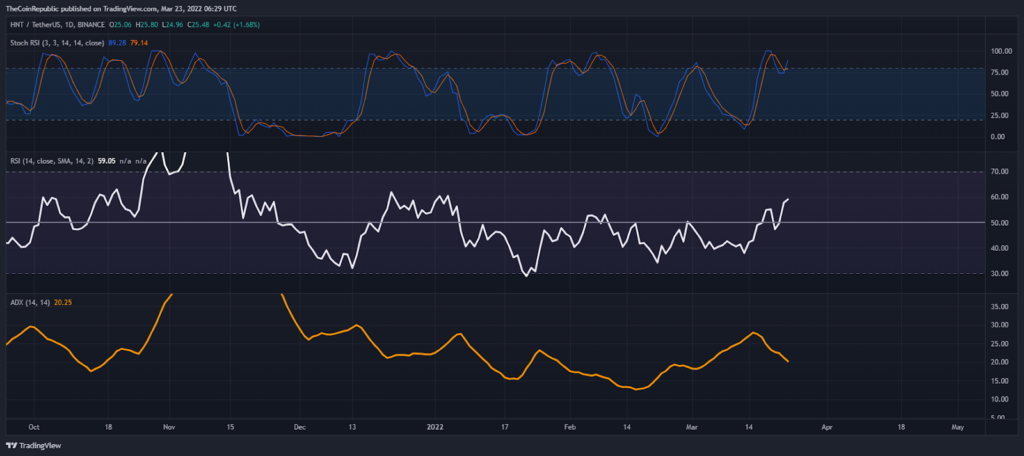
Stoch RSI saw a bullish move after dipping into an oversold area and now the RSI is looking towards an overbought area in terms of the daily price chart.
However, the Relative Strength Index (RSI) is yet to test its overbought territory on the daily price chart and is now trading at 59-mark. The semi-line (50-point) may act as a support line in the upcoming trading sessions.
The Average Directional Index (ADX) is set to move below the 20-level. Suggest a slight neutral momentum for a helium coin.
Conclusion
The overall cryptocurrency market appears to be stable, and there is an opportunity for Helium holders to break the neckline of the double bottom formation and return to the bullish rally.
Support level- $20 and $15
Resistance level- $26 and $30
Disclaimer
The views and opinions stated by the author, or any people named in this article, are for informational ideas only, and they do not establish financial, investment, or other advice. Investing in or trading crypto assets comes with a risk of financial loss.




