
 Minter
 Quack AI
 Starknet
 NEAR Protocol
 Sui
Sui Hyperliquid
 Bittensor
- Quant token has breached the symmetrical triangle pattern to the upside on March 22.
- The QNT token is trading higher than the 20 and 50-day moving averages in terms of the daily price chart.
- The Relative Strength Index is going to come into the overvalued zone after a bit of consolidation.
This is coupled with selling pressure by giving the Quant token a breakout of a sloping trendline, where token has been trending regularly since peaking at $430. QNT price action has been witnessing higher-lows and lower highs (Symmetric Triangle Pattern) since the month of January, but finally, on March 22, the bulls found a chance to win the fight, resulting in the asset moving higher.
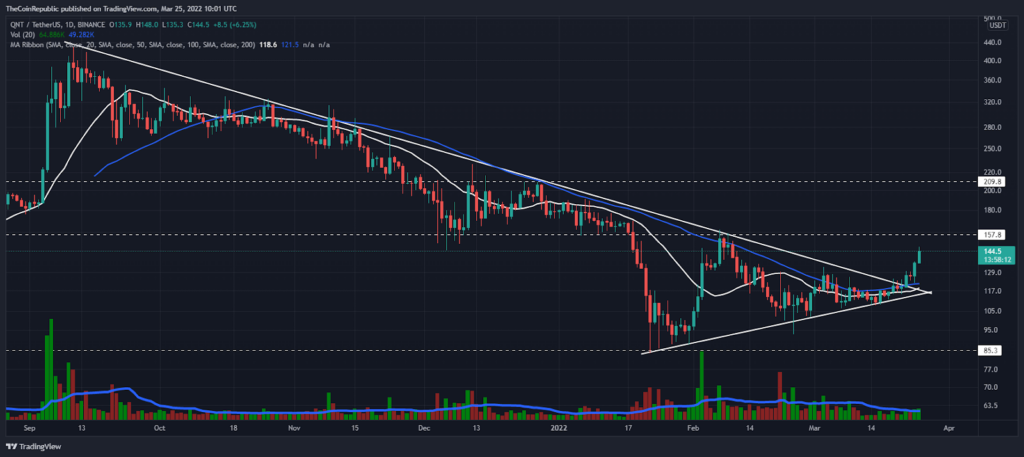
Quant Coin is signalling in a bullish zone, with the coin rising 15% in price to $145.4 at the time of writing. This week is a great week for buyers as buyers have received around 24% ROI. Bitcoin pair with Quant Coin is at 0.003308 satoshis, QNT/ETH pair price is trading at 0.04655, an increase of 12.5% the same way.
Quant Coin has immediate resistance at $150 and a perfect example of a support level is the $100-psychological round level. However, the daily trading volume provides a highly liquidated market and as a result, the token has gained around 114% trading volume over the past night. Furthermore, the volume to market capitalization ratio is 0.04675.
In the context of the daily price chart, the QNT token is witnessing price action above important moving averages (such as the 20,50 and 100 EMA). But it remains to be seen whether the bulls are able to close the daily price candle above the 100-EMA.
Finally, QUT broke the symmetrical triangle pattern
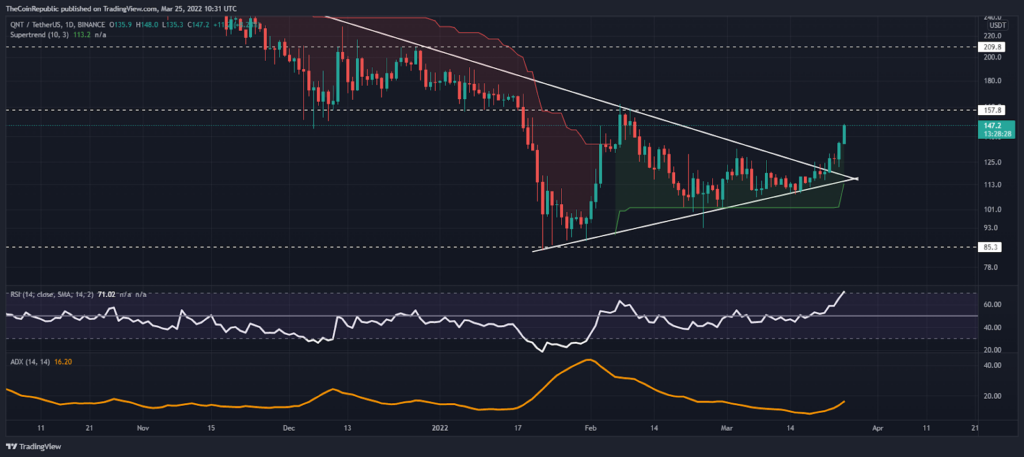
The Super Trend indicator has been supporting the buyers on the daily price chart for the past several days.
The Relative Straight Index (RSI) is at 70-mark at the time of writing and is about to enter an overbought phase.
The Average Directional Index is slightly bullish but remains below the 20-level, indicating soft bullish momentum.
Conclusion
The Quant token is approaching the nearest resistance level of $150. Technical indicators suggest a bullish trend until the token price approaches resistance. On the other hand, if the QNT turns down, the bears may go on the offensive again.
Support level – $100 and $85
Resistance level – $160 and $200
Disclaimer
The views and opinions stated by the author, or any people named in this article, are for informational ideas only, and they do not establish the financial, investment, or other advice. Investing in or trading crypto assets comes with a risk of financial loss.




