
 Boomer
 hi
hi Claudia
 Covenant x402
 Quantus
 Pearl
Pearl NEAR Protocol
- Telcoin took support of $0.0045 and recovered sharply after the terrible drop; Is this V-Shape Recovery?
- The Telcoin is moving towards an important resistance level with the buy signal area of the Super Trend indicator.
- The Telcoin belonging to the bitcoin pair is trading down 7.8% at 0.00000001837 satoshis.
2021 was a good year for Telcoin investors as the coin surged 39000% to an all-time high of 0.06499711. Since then, TEL has struggled to overcome the pressure of token sales. Recently the bulls have been able to jump above the previous swing highs.
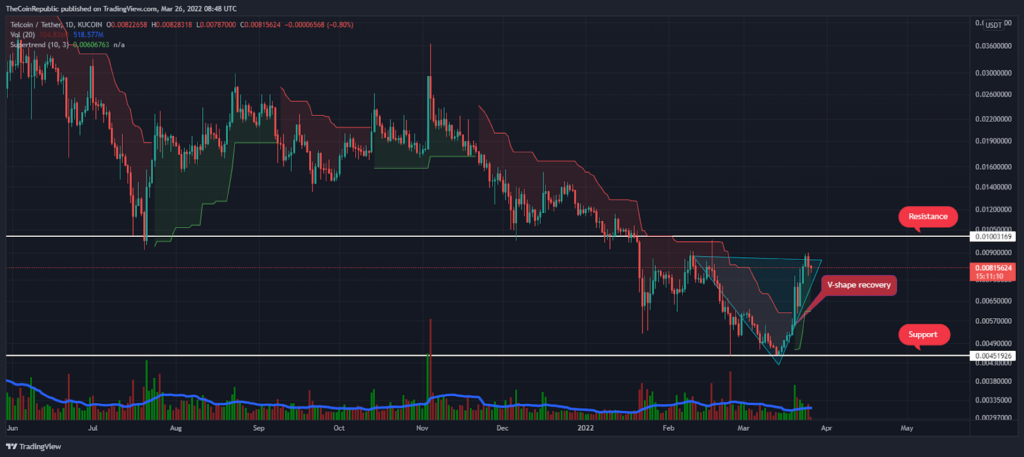
TEL token trend appears to be in the bullish territory after recovering from the 2022 year low. However, Telcoin’s price action is providing a V-shaped recovery on the daily price chart. Since last week, Telcoin has recovered almost 100% of its value to the most recent weekly high.
However, TEL holders are facing a retracement phase; Therefore, at the time of writing, the price is down 6.8% to $0.00817, according to CMC. Thus the Telcoin belonging to the bitcoin pair is trading down 7.8% at 0.00000001837 satoshis.
On March 20, the Super Trend indicator gave a bullish signal for the TEL token in terms of the daily price chart. On the same day, the coin saw its most volatile day in the month of March. Similarly, Telcoin achieved 25% trading volume last night. The volume to market capitalization ratio is 0.1829.
Bulls barely attempt to maintain TEL token above 100-EMA
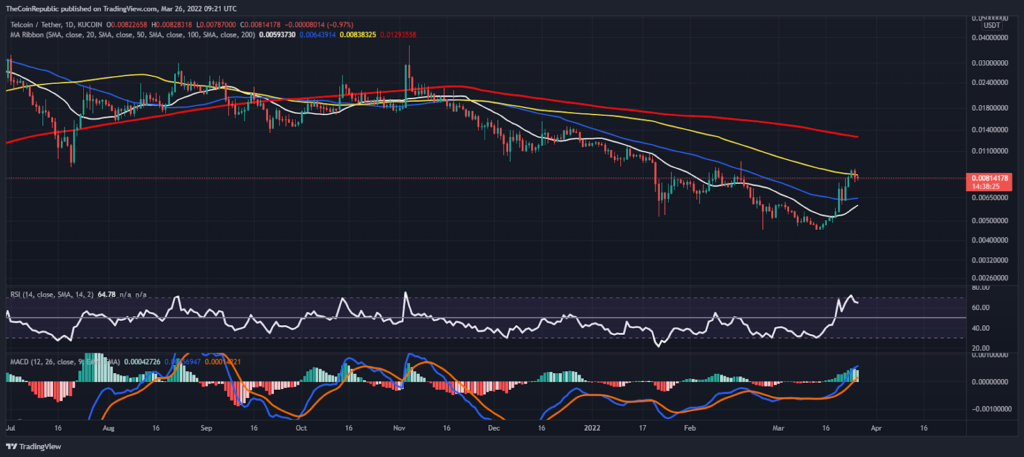
The Telcoin price is trading close to the 100-day EMA after successfully holding the 20 and 50 EMAs. The bulls are still struggling to rise above the 100-EMA line.
The Relative Strength Index (RSI) is looking towards an overbought zone in the context of the daily price chart. The RSI is forming a high-low before reaching the sky zone.
The Moving Average Convergence Divergence (MACD) is trading higher after a bullish crossover and has moved into positive territory on the daily price chart.
Conclusion
Telcoin price has reversed the previous downtrend showing a V-shaped recovery. The bears may still find an opportunity to sell the coin near the 100-EMA line. TEL holders must maintain the price above the 100-EMA as soon as possible.
Support level – $0.0045 and $0.0026
Resistance level – $0.010 and $0.020
Disclaimer
The views and opinions stated by the author, or any people named in this article, are for informational ideas only, and they do not establish financial, investment, or other advice. Investing in or trading crypto assets comes with a risk of financial loss.




