
 Dacity Coin
 Injective
 Pump.fun
 Pearl
Pearl Starknet
 Quantus
 NEAR Protocol
- In March, Mina coin saw a V-shaped recovery with a price action pole and flag pattern in the daily price chart.
- MINA coin price is rising above the 0.5 Fibonacci retracement level; still, it is yet to break the 0.786 Fibonacci level (Bullish barrier).
- The bitcoin pair belonging to Mina Coin is trading up 3.4% at 0.00007644 satoshis.
In March, MINA recorded an unpredictable session where MINA’s price action sparked a roller-coaster ride during a scary downtrend or V-shaped recovery. Since early January, a double top formation has formed near the $4.0 mark (major resistance); Therefore, this area was seen as a demand zone and forced a V-shaped recovery.
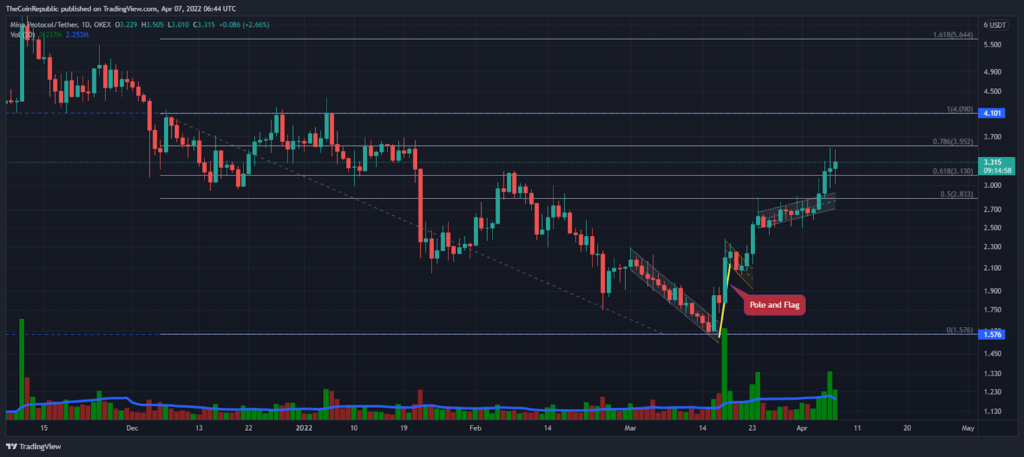
The daily price chart depicts MINA coin’s pole and flag price pattern during recovery. Near the 0.5 ($2.8 mark) level of Fibonacci retracement, holders recorded sideways to a bullish zone (ascending parallel channel).
Thus, MINA’s price is just below the Fib level of 0.786 and is trading with a gain of 1% at $3.30. However, today the asset is forming inside the candle. Moreover, the MINA/BTC pair price is up 3.4% at 0.00007644 satoshis.
Nowadays, the trading volume increases during the bullish trend, which locates sustainability in upwards momentum. As of now, MINA regained 15% volume in the last 24-hours.
Is this the right time to buy Mina?
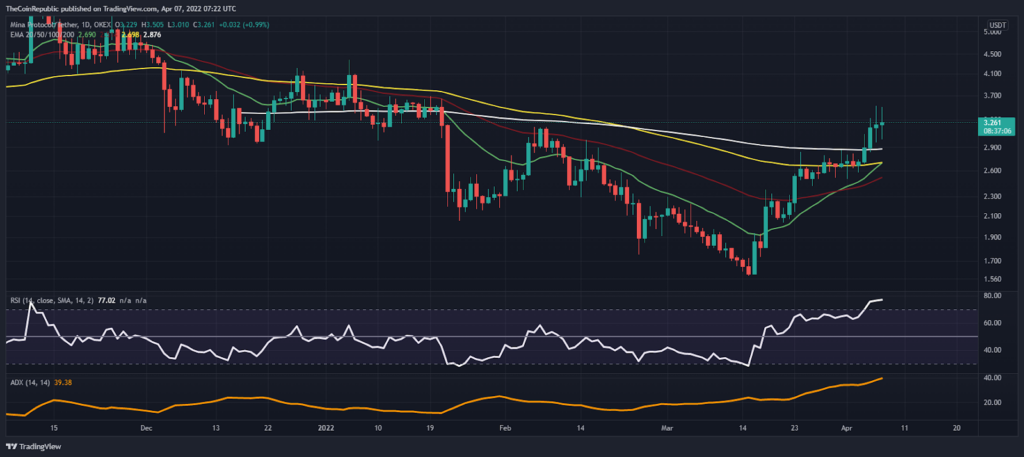
There is no doubt that buyers have control over the MINA coin and the moving averages are the biggest paradigm of this. However, the crucial 20, 50, 100 and 200 EMAs are well below the live price.
During the bullish rally, the daily RSI is forming above the half-line (50-mark) and is currently looking in overbought territory.
The Average Directional Index is moving at 39-point, which indicates a strong bullish trend for the MINA coin.
Conclusion
Although MINA is under bullish consolidation, it remains below the 0.786 Fibonacci retracement level which could affect the directional trend. For more upside, the bulls need to break this barrier with massive trading volume for stability.
Resistance level- $4.0 and $6.4
Support level- $3.5 and $4.1
Disclaimer
The views and opinions stated by the author, or any people named in this article, are for informational ideas only, and they do not establish the financial, investment, or other advice. Investing in or trading crypto assets comes with a risk of financial loss.




