
 Covenant x402
 Doge Pepe
 Tetsuo Super Intelligence
 Claudia
 Boomer
 hi
hi Quantus
- The Celer Network token attempted to reach the psychological round level of $0.10, but it failed to sustain and continued to decline.
- The Celer Network token is trading below a key moving average in the context of the daily price chart.
- The CELR token along with the bitcoin pair is trading at 0.000001193 Satoshis, which is looking neutral.
The Celer Network token has been falling lower as the asset reached an all-time high of $0.1989 on 26 September 2021, as the CELR token lost over 75% of its cost since then. Meanwhile, price action suggests a higher-low, lower-high formation during a roller-coaster ride.
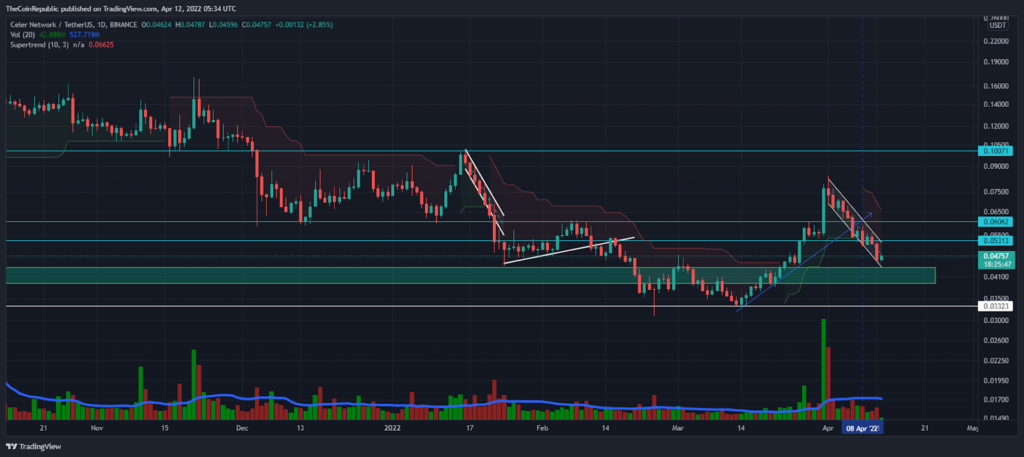
Near the 2022 lows, the CELR token showed a sharp recovery with support from an upward trendline (blue) and the asset interrupted this bullish trendline a few days ago, falling to a 2-month high at $0.0843, seen in the parallel channel (white).
Thus, the daily price chart of the CELR token is looking below the red signal line of the Super Trend indicator. At the time of writing, according to CMC, the CELR token is trading at $0.04776, down 5.24% over the past 24 hours. Furthermore, the CELR token along with the bitcoin pair is trading at 0.000001193 Satoshis, which looks neutral.
On 31 march, CELR token showed the highest volatile marker in last 6 months. Therefore, the coinn has regained moreover 36% gain in a day. However, the liquidity seems to be low this week and the volume saw a 11.8% drop in the last night, with the $36.8 Million volume.
In Long Term Possibility, CELR Outlook Looks In Retracement Phase
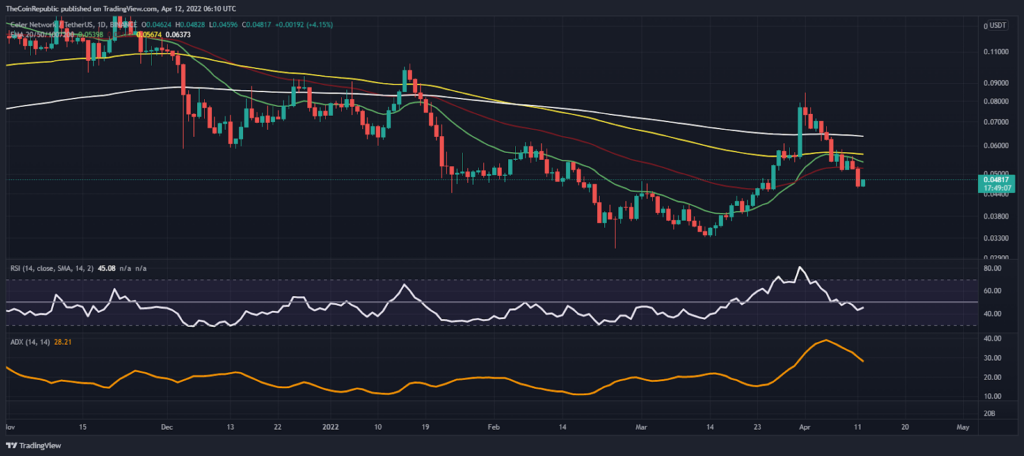
The Celer Network token is looking bearish below significant moving averages (such as 20,50,100 and 200 EMAs) in the context of the daily price chart. For the upcoming trading sessions the 50 EMA may act as a bullish hurdle.
The RSI is moving below the semi-line (50-mark) in terms of the daily price chart. The RSI is likely to move into oversold territory below any buying opportunities.
ADX started a downside correction and was present at the 28-mark, indicating strong bearish momentum for the Celer token.
conclusion
The Celer token is approaching a demand zone (green), which appears to be a bull hedge point. However, in the lower time frame, the coin is looking bearish. On the other hand, in the weekly price chart, CELR is witnessing a bullish move with a minor retracement phase.
Resistance level- $0.080 and $0.100
Support level- $0.040 and$0.030
Disclaimer
The views and opinions stated by the author, or any people named in this article, are for informational ideas only, and they do not establish the financial, investment, or other advice. Investing in or trading crypto assets comes with a risk of financial loss.




