
 Quack AI
 NEAR Protocol
 Quant
Quant Quantus
 Pearl
Pearl Ondo
Ondo Bitway
- Symbol coin showing high-low formation in terms of daily price chart.
- XYM Coin is looking below the 20, 50, 100 and 200 day exponential moving averages on the daily price chart.
- The XYM/BTC pair price is 0.000002406 Satoshi, with a loss of 13.5%.
The symbol coin had a very good bull run from October to November, with the bulls receiving around 420% of their cost. Since the November high, XYM has been following a low-low and low-high formation in the context of the daily price graph.
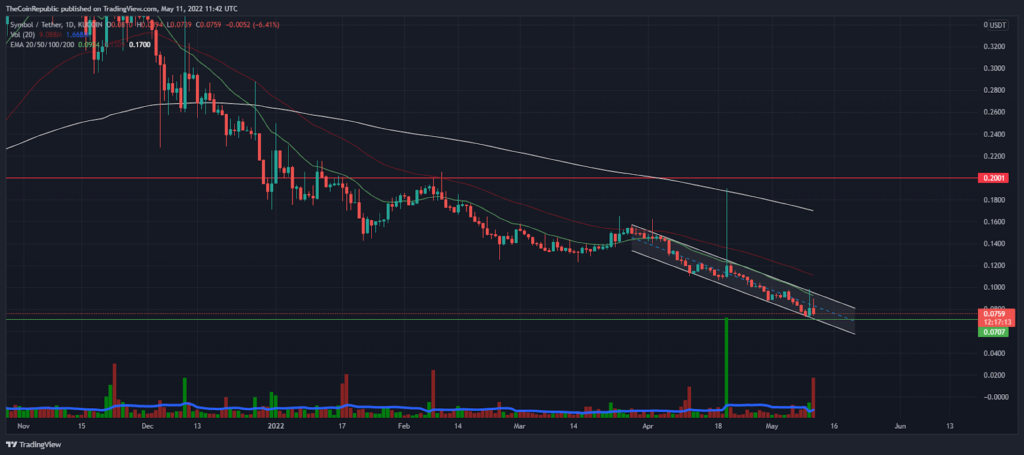
The symbol coin is looking in a falling wedge pattern (white) on the daily price chart. But XYM Coin again tested the support line of the following channel. So if the bulls fail to sustain the cost above the recent weekly low of $0.072, which has now turned into an important support level for XYM investors.
At the time of writing, the XYM token is trading at $0.0757, down 14% over the past 24 hours, according to CMC. The market cap stood at $425.8 million as of last night’s data. Moreover, the XYM/BTC pair price is 0.000002406 Satoshi, with a loss of 13.5%.
XYM Coin is trading below the 20, 50, 100 and 200 day exponential moving averages on the daily price chart. However, last night traders saw a highly volatile session in the last 20 days. Thus, the trading volume increased by 39% compared to the previous night.
Bulls attempt to manage cost above weekly low
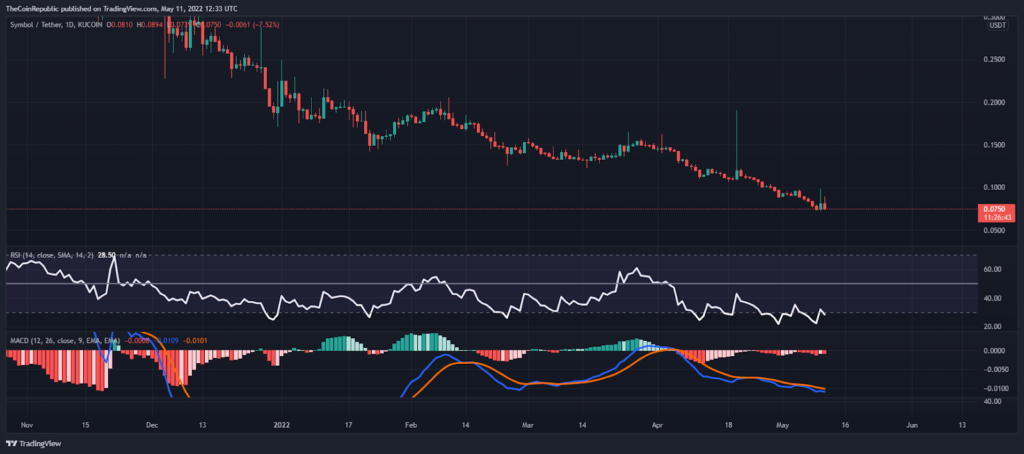
The RSI indicator is drawing a lower-higher formation in the context of the daily price chart. Again the indicator moved towards the overbought area.
The MACD indicator is showing a strong selling trajectory as it is moving downwards into negative territory on the daily price graph.
conclusion
The bears became aggressive again; Hence, XYM Coin is about to break the 6 month low. If the price breaks down the parallel channel, the bears may stop at the $0.05 mark.
Support level – $0.070 and $0.050
Resistance level – $0.10 and $0.150
Disclaimer
The views and opinions stated by the author, or any people named in this article, are for informational ideas only, and they do not establish financial, investment, or other advice. Investing in or trading crypto assets comes with a risk of financial loss.




