
 Covenant x402
 hi
hi Pearl
Pearl Quantus
 Pudgy Penguins
 Boomer
 Lighter
- In terms of the daily price chart, Fantom Coin is performing poorly in a descending parallel channel.
- On the 4-hourly price graph, see the 20 Day Exponential Moving Average below FTM price.
- The Fantom Coin belonging to the bitcoin pair is trading at 0.0000144 satoshis, a gain of 15.8%.
Since early April, the currency of Fantom (FTM) has been consistent with lower-lows and lower-highs construction, with a fall of 85%, which goes with the negative trend. However, a surge in trading volume from last week and a 90% climb from the $0.27 support point to the coin potentially undergoing a bull run.
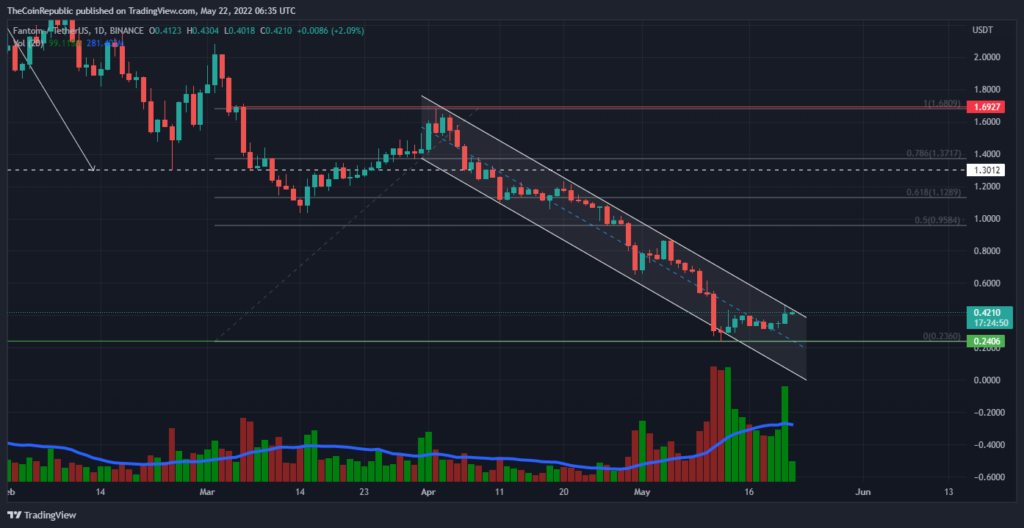
Over the last seven weeks, the price of Fantom (FTM) has steadily declined, breaching key support levels. During the decline, the bulls were defeated at $1.0, which has now turned into key resistance.
During the recovery FTM coin has recovered around 7% this week and this weekly closing may bring relief to the buyers. Thus, the altcoin is approaching the upper boundary of the descending parallel channel (white). It remains to be seen whether the bulls can overcome the selling pressure or not.
At the time of writing, FTM is trading with upward momentum at $0.42 mark with a gain of 16% in last 24 hours as per CMC. Similarly, the Fantom coin belonging to the bitcoin pair is trading at 0.0000144 satoshis, a gain of 15.8%.
Above this bearish pattern, FTM investors can target the $1.0 conceptual round level as their first achievement. Nowadays, volatility increases, resulting in a 78% increase in trading volume compared to the previous night.
Bulls need to hit 20 EMA soon
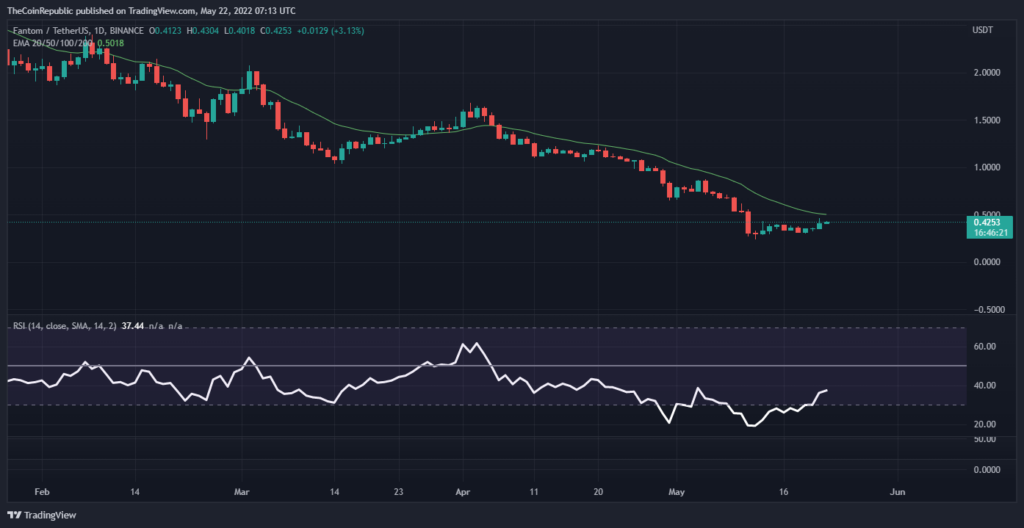
On the 4-hours price graph, see the 20-day exponential moving average below the FTM price, but conversely, the 20 EMA on the daily chart appears as a bullish barrier for over three weeks.
The Daily RSI has crossed the previous swing high 38 mark and is not moving towards the semi-lien (50 mark).
Conclusion
The bulls have a high chance of pushing the price of Fantom Coin over the 20 EMA as the first goal. The conceptual round level will be the next aim above this level.
Resistance level- $0.50 and $1.0
Support level- $0.24 and $0.20
Disclaimer
The views and opinions stated by the author, or any people named in this article, are for informational ideas only, and they do not establish the financial, investment, or other advice. Investing in or trading crypto assets comes with a risk of financial loss.




