
 Boomer
 Claudia
 Covenant x402
 Pearl
Pearl Bitcoin
 Quantus
 Pudgy Penguins
- Arweave coin reaches into the resistance zone amid bounce-back.
- The AR crypto is well remaining above the significant moving averages like 20 and 50.
- The Market cap of AR coin is up 10% at $419 Million as per the last 24-hour’s data of CMC.
The Arweave coin trades inside the resistance zone of $12 to $13.5 (Gray Box). As soon as, the AR price enters into this horizontal range of accumulation, buyers struggle in the retracement phase in intraday trading session. On 18 June, AR investors became the witness of the latest 2022 low of $7.17 Mark.
The AR Coin displays higher-lows and lower-highs formation for the past several days. For the past 4-weeks, the weekly price action shows solid bullish candles while the price is trading at $12.5 mark at the time of writing.
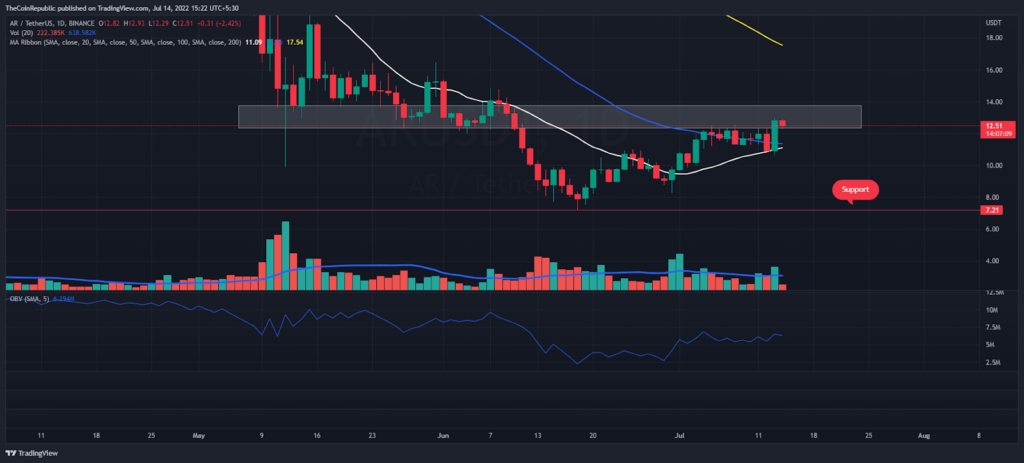
During bullish momentum, bulls ultimately reclaimed the psychological round level of $10, which turned into the immediate support level. Meanwhile, Market cap of AR coin is up 10% at $419 Million as per the last 24-hour’s data of CMC. Further, the Arweave coin belonging to the Bitcoin pair is higher by 9.8% at 0.0006339 Satoshis.
After a long period, bulls propelled the AR crypto price above the 20 day moving average as well as the 50 day moving average. The 20 DMA became a short-term support for buyers. Despite the fact, the 100 DMA still remains to be hit.
During higher momentum, the trading volume increase gradually, as a result, speculators saw a pump in volume of 64% in the last 24-hours. Similarly, the On Balance Volume (OBV) slightly up during uptrend.
RSI moved above semi-line
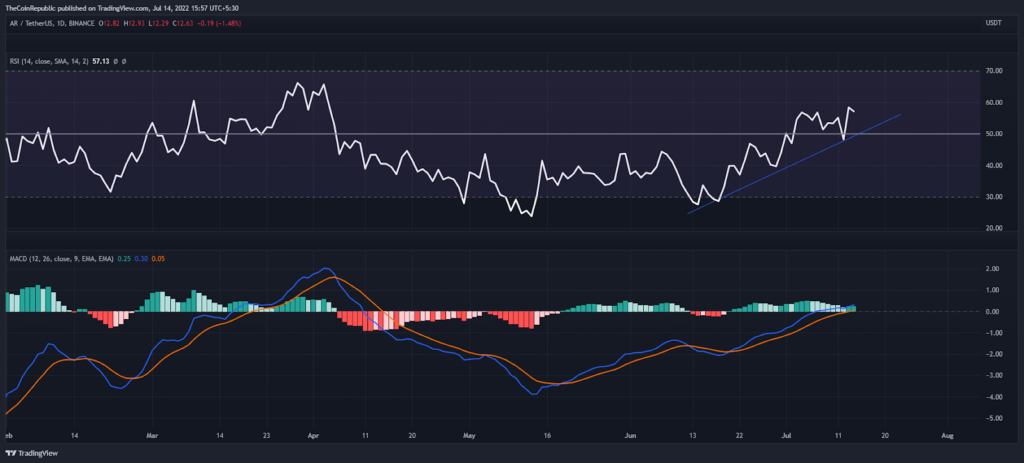
The RSI indicator is observing above the semi-line (50 mark) as well as RSI peak remains above the bullish trendline (blue). Similarly, the MACD reached higher than the neutral zone in the context of daily price chart.
Conclusion
Although the RSI and MACD indicators are showing bullish bias for Arweave coin. Also altcoin maintains the cost above 50 DMA, which is the vital defending zone for buyers, so if buyers push the AR price higher then this resistance zone then short-covering may occur till $20 level.
Support level – $10 and $7.0
Resistance level – $13 and $20
Disclaimer
The views and opinions stated by the author, or any people named in this article, are for informational ideas only, and they do not establish financial, investment, or other advice. Investing in or trading crypto assets comes with a risk of financial loss.




