
 Covenant x402
 Tetsuo Super Intelligence
 Doge Pepe
 Claudia
 Boomer
 Quantus
 Bitcoin
- IOTA (MIOTA) price action is forming a bearish chart pattern on the 4-hours price scale.
- The IOTA coin is trading between the mid-band and lower-band of the Bollinger Bands indicator.
- The market cap remained neutral at $781 million in the last 24 hours.
The IOTA token registered a sharp uptrend from mid-July to mid-August as bulls gained over 45% on their investments. Of late, the bulls started booking profits, which helped the bears pull IOTA price to 2022 lows. Within two weeks, the bears have wiped out all the gains of the recent rally.
Buyers struggle to sell as bears dump MIOTA coins on each rise. As a result, the price attracts a lower-higher formation. In fact, on the hourly price scale, crypto trades occur below a falling trend line (in white) and above the bulls hedge zone (gray box), indicating a descending triangle pattern.
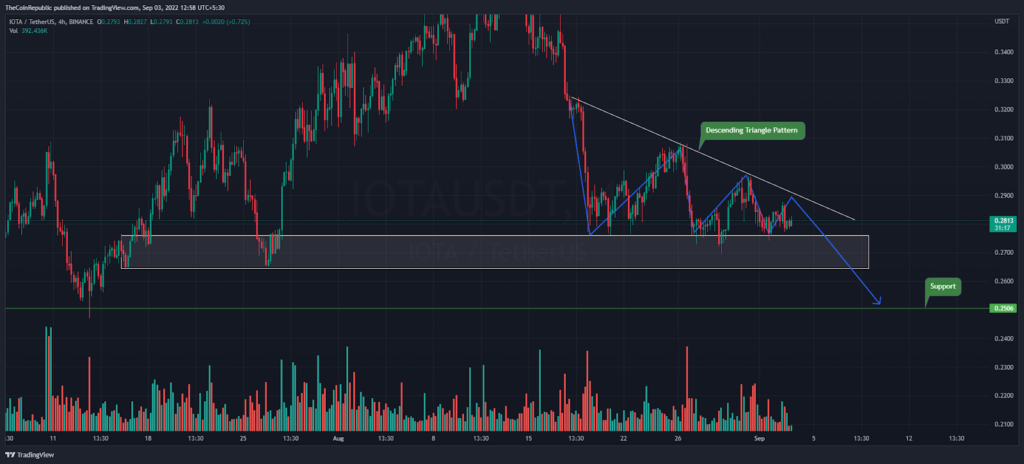
If the bulls fail to hold the price in the $0.264 to $0.275 support area, buyers could see a breakout of the bearish price pattern. This breakdown could prompt the bears to retest the annual bottom once again before a rally. At press time, the triangle range is narrowing while the IOTA token is trading at the $0.281 mark.
Any drop in Bitcoin could lead to a breakdown of IOTA. Meanwhile, the market cap remained neutral at $781 million in the last 24 hours. Trading volume appears to be neutral with respect to yesterday’s volume data, which was $8 million. Buyers can easily identify a bear attempt if trading volume increases.
Bulls Try to Manage IOTA Above Lower-Band of BB Indicator
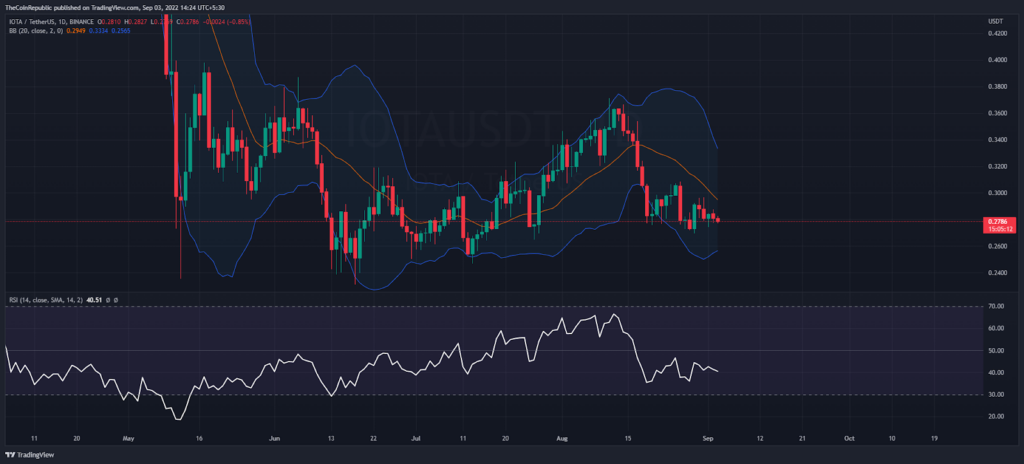
MIOTA coin is trading in a sideways trend. Meanwhile, the IOTA coin is trading between the mid-band and lower-band of the Bollinger Bands indicators. Moreover, the RSI indicator is looking flat at the 40-level in terms of the daily price scale.
Conclusion
With regard to bearish price action, IOTA (MIOTA) investors are accumulating prices in an immediate hedge zone. Despite the accumulation, the bulls still need to maintain the hedge zone to avoid overbought.
Support levels- $0.30 and $0.25
Resistance levels- $0.40 and $0.70
Disclaimer
The views and opinions stated by the author, or any people named in this article, are for informational ideas only, and they do not establish the financial, investment, or other advice. Investing in or trading crypto assets comes with a risk of financial loss.




