
 Minter
 Bittensor
 Hyperliquid
 NEAR Protocol
 Monero
 Pearl
Pearl Quantus
- Chain price has been bearish and falling through a descending parallel channel over the hourly chart.
- XCN crypto has fallen below 20, 50, 100 and 200-days Daily Moving Average.
- The pair of XCN/BTC is at 0.000003793 BTC with an intraday drop of 1.41%.
Over the hourly price chart, the chain price has been decreasing along a parallel downward channel. For the token to enter its recovery phase, it must maintain above the top trendline of the falling pattern. To signal a breakout from the descending parallel channel, the XCN currency needs to attract buyers during intraday trading. The token is being pulled from the edge of the descending channel by XCN bears. The cryptocurrency must accumulate XCN bulls before it can break out of the channel.
The market capitalization of Chain Price, which is currently CMP at $0.0755, has decreased by 0.39% during the past 24 hours. The intraday trading session saw a 19% decline in trade volume. This demonstrates how bears are attempting to drag the token in the direction of the sliding parallel channel’s lower trendline. Volume to market cap ratio is 0.002926.
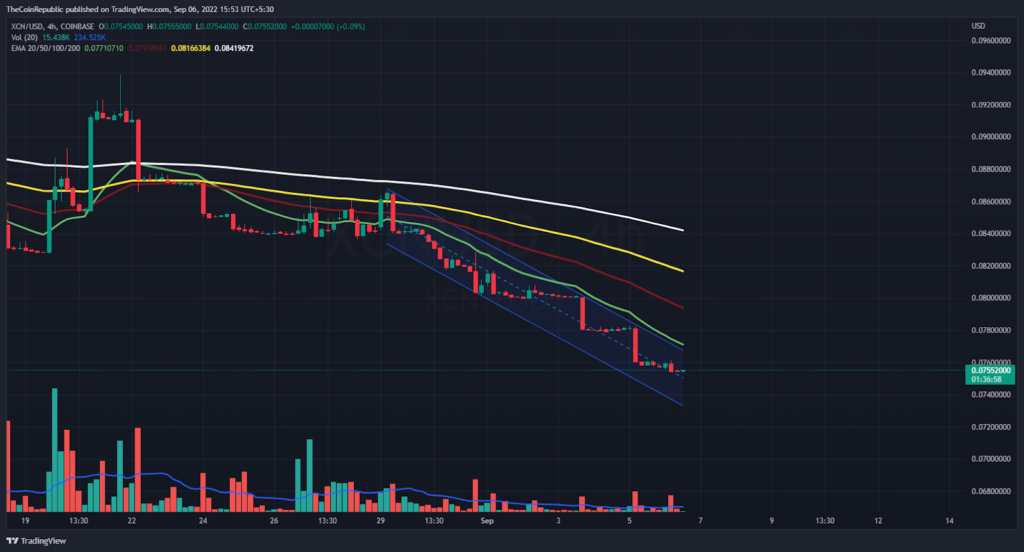
To stay out of the downward channel and maintain its position, XCN cryptocurrency must draw buyers. The token must find customers in order to prevent falling into the hands of the short-sellers since the market is currently completely controlled by bears. However, the volume change is below average and must continue.
What do Technical Indicators suggest about XCN?
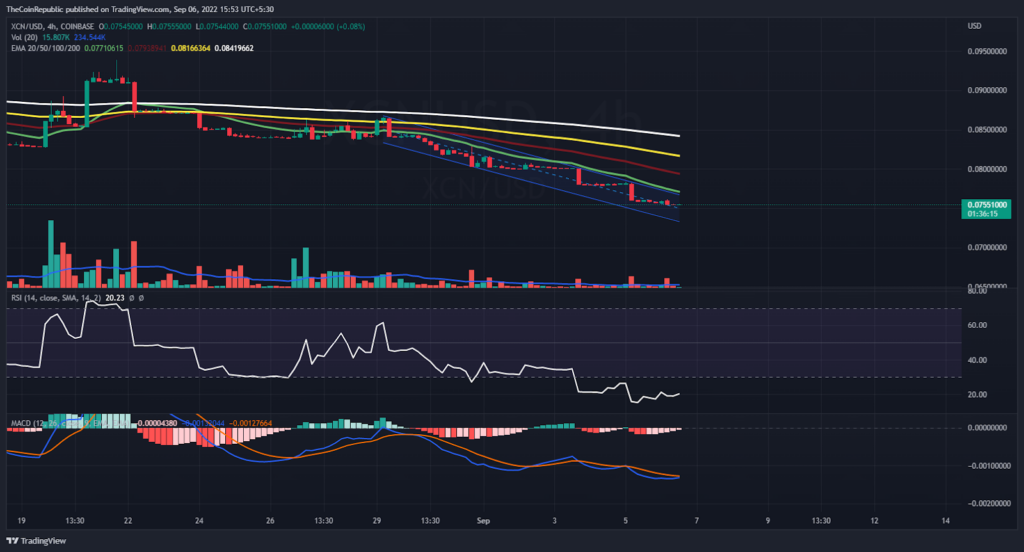
XCN coin price is trying to surge out from the falling parallel channel. However, the token still needs to attract a significant amount of buyers to register its breakout. Technical indicators suggest the uptrend momentum of the XCN coin. Relative Strength Index showcases the uptrend momentum of the XCN coin. RSI is at 20 and is approaching back from extreme oversold territory. MACD exhibits the uptrend momentum of the XCN coin. The MACD line is about to cross the signal line upwards, registering a positive crossover. However, the volume change is below average and must continue.
Conclusion
Over the hourly price chart, the chain price has been decreasing along a parallel downward channel. For the token to enter its recovery phase, it must maintain above the top trendline of the falling pattern. To signal a breakout from the descending parallel channel, the XCN currency needs to attract buyers during intraday trading. The token is being pulled from the edge of the descending channel by XCN bears. Technical indicators suggest the uptrend momentum of the XCN coin. Technical indicators suggest the uptrend momentum of the XCN coin. The MACD line is about to cross the signal line upwards, registering a positive crossover. However, the volume change is below average and must continue.
Technical Levels
Support Levels: $0.075
Resistance Levels: $0.75
Disclaimer
The views and opinions stated by the author, or any people named in this article, are for informational ideas only, and they do not establish the financial, investment, or other advice. Investing in or trading crypto assets comes with a risk of financial loss.




