The Market Periodical
  • Home
  • Markets
  • Opinion
  • Cryptocurrency
  • Blog
Contact Us
  • Login
The Market Periodical
  • Home
  • Markets
  • Opinion
  • Cryptocurrency
  • Blog
Contact Us
The Market Periodical
Home Cryptocurrency

KAVA Token Price Analysis: KAVA token price is trading at the demand zone forming a reversal chart pattern, what happens next?

Nancy J. Allen by Nancy J. Allen
September 27, 2022
in Cryptocurrency, Markets, News
0
KAVA Price Analysis
195
SHARES
1.5k
VIEWS
Share on FacebookShare on Twitter
  • The KAVA token price is trading at the demand zone on a daily time frame.
  • The token price is forming a falling edge pattern on a daily time frame.
  • The pair of KAVA/BTC is trading at the price level of 0.0000821 with a decrease of -2/91% in the past 24 hours.
Source: KAVA/USDT by tradingview

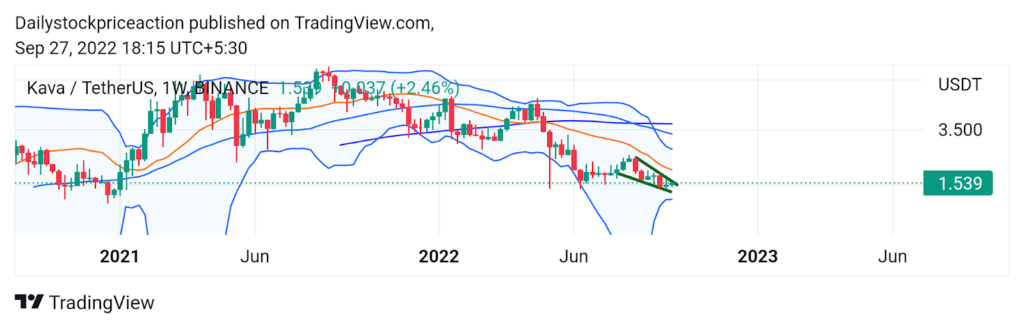
The KAVA token price as per the price action is hovering around the demand zone on a larger time frame. The token price has faced the heat prevailing in the overall market, due to which it was seen falling to the long-term demand zone. The token price is forming lower low and lower high formation on a daily time frame while on a smaller time frame the token price is doing the opposite. As of now, the token price is showing a reversal sign following the consolidation. At present, the KAVA token price is trading below the 50 and 100 Moving Averages. The token price fell below the important MAs during the previous bearish trend. Since then the token price has failed to surpass the 50 and 100 MAs. Moving upwards the token price can be seen facing the strong bearish pressure from these MAs. The KAVA token price is trading at the lower band of the Bollinger band indicator after failing to surpass the upper band. Volumes have been normal following the consolidation. The KAVA token price has also fallen below the 20 EMA indicating bearishness for the short term.

The KAVA token price is forming a falling wedge pattern on a daily time frame

Source: KAVA/USDT by tradingview

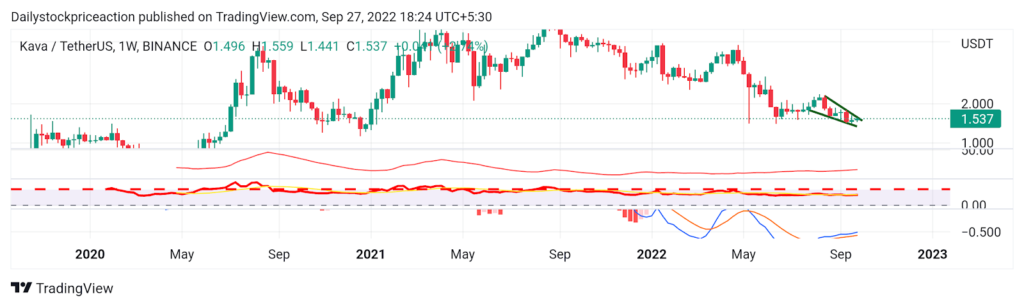
Average Directional Movement Index: ADX curve has been dipping on a weekly time frame as the token continues to fall. In an hourly time frame, the ADX curve has dipped out of the 20 mark and has turned upwards. As seen in the 4-hour time frame the ADX curve has risen above the zone indicating strong bullishness. As the token price hovers around the supply zone, the ADX curve is still pointed upside. Investors should wait for a  breakout of the supply zone with a positive candle formation.

Related articles

Tron Price Analysis

Tron token price analysis: TRX token price shows staggering jump off the demand zone.

January 26, 2023
SHIB Price Analysis

SHIB coin price analysis: SHIB coin price forms a staggering pattern.

January 26, 2023

Relative Strength Index: RSI curve is trading at the level of 44.75. The RSI curve is yet to cross the halfway mark of 50. Once the token crosses the supply zone of 1.689 the token price can be seen moving up with strong bullish momentum. The RSI curve has crossed the 14 EMA yellow line indicating a short-term bullishness. Once the RSI crosses the halfway mark of 50 the MANA token price can be seen breaking the supply zone, supporting the trend.

Moving Average Convergence Divergence: The KAVA token price is still bearish on a larger time frame. On a smaller time frame, the token price has bounced off the demand zone. As a result, the MACD indicator has triggered a positive crossover. The blue line crossed the orange line on the upside indicating bullish for a shorter period if bears don’t overpower bulls for the upcoming 72 hours. If the token price breaks the supply zone resulting in the breakout of the falling wedge pattern, then the MACD line can be seen widening supporting the trend.

Conclusion: The KAVA token price is trading at the demand zone on a daily time frame. The token is still bearish on the weekly time frame while it forms a reversal chart pattern On a daily time frame. An investor should wait for a proper signal of breakout on either side. It remains to see if the bulls show the power to fight back or if the bears continue to dominate.

SUPPORT: $1.3 and $1.2

RESISTANCE: $2.1 and $2.5

Disclaimer 

The views and opinions stated by the author, or any people named in this article, are for informational ideas only, and they do not establish the financial, investment, or other advice. Investing in or trading crypto assets comes with a risk of financial loss.

Tags: Cryptocurrency
Share78Tweet49
Nancy J. Allen

Nancy J. Allen

Nancy J. Allen is a crypto enthusiast and believes that cryptocurrencies inspire people to be their own banks and step aside from traditional monetary exchange systems. She is also intrigued by blockchain technology and its functioning.

Related Posts

Tron Price Analysis

Tron token price analysis: TRX token price shows staggering jump off the demand zone.

by Nancy J. Allen
January 26, 2023
0

The TRX token price as per the price action is bullish, as it manages to bounce off the supply zone.The...

SHIB Price Analysis

SHIB coin price analysis: SHIB coin price forms a staggering pattern.

by Nancy J. Allen
January 26, 2023
0

The SHIB coin price is trading above the long-term demand zone on a daily time frame.The SHIB coin price is...

BSV Price Analysis

BSV Token price analysis: BSV token price forms a strong pattern.

by Antonio K Smith
January 26, 2023
0

The BSV Token price is hovering around the supply zone on a daily time frame, following the choppy moves in...

MKR Token price analysis

MAKER token price analysis: MKR token price gets ready for a mammonthous move.

by Antonio K Smith
January 25, 2023
0

The MKR token price is trading at the supply zone on a daily time frame.The MKR token price is forming...

Zcash Price Analysis

ZCASH token price analysis: ZCASH token price initiates a reverse gear.

by Antonio K Smith
January 25, 2023
0

ZCASH token price has bounced off the demand zone strongly following a strong bullish momentum in the overall cryptocurrency market.ZCASH...

Load More
  • Trending
  • Comments
  • Latest

Kadena price analysis: KDA coin is following the upwards trendline after forming the bullish pattern

February 9, 2022
cryptocurrency

AQUA Airdrop is set to Roll out!

January 7, 2022
AMP Price Analysis: AMP Coin Trading in Horizontal Range-Bound consolidates, Will it be able to retain up to $0.088?

Will Amp Token’s Escalating Demand Drive Its Price To $1?

February 21, 2022
MIOTA Price Analysis: IOTA Token Price Struggles To Sustains Higher Than $1 Mark

Firefly Wallet Powered by IOTA, Starts Staking on Shimmer and Assembly Tokens

December 23, 2021
Tron Price Analysis

Tron token price analysis: TRX token price shows staggering jump off the demand zone.

0
Bitfinex

Bitfinex Lets Users Earn on their Bitcoin with Celsius

0
Binance Burned the Highest Number of BNB Tokens Till Day Worth $68 Million

Binance Burned the Highest Number of BNB Tokens Till Day Worth $68 Million

0
Cryptocurrency

U.S. Congress Members Have Introduced 40 Bills on the Subject of Cryptocurrencies

0
Tron Price Analysis

Tron token price analysis: TRX token price shows staggering jump off the demand zone.

January 26, 2023
SHIB Price Analysis

SHIB coin price analysis: SHIB coin price forms a staggering pattern.

January 26, 2023
BSV Price Analysis

BSV Token price analysis: BSV token price forms a strong pattern.

January 26, 2023
MKR Token price analysis

MAKER token price analysis: MKR token price gets ready for a mammonthous move.

January 25, 2023
  • Home
  • Contact Us
  • SUBMIT PR

© 2022 The Market Periodical

 
No Result
View All Result
  • Home
  • Markets
  • Opinion
  • Cryptocurrency
  • Blog
  • Contact Us

© 2018 JNews by Jegtheme.

Welcome Back!

Sign In with Google
OR

Login to your account below

Forgotten Password?

Create New Account!

Sign Up with Google
OR

Fill the forms below to register

All fields are required. Log In

Retrieve your password

Please enter your username or email address to reset your password.

Log In
Are you sure want to unlock this post?
Unlock left : 0
Are you sure want to cancel subscription?