
 Minter
 Quack AI
 NEAR Protocol
 Sui
Sui Hyperliquid
 Cardano
 Raydium
- BCH coin price has been falling for the last couple of months and recently it slipped below the important demand zone on a weekly time frame.
- The BCH coin price is forming a descending triangle pattern on a daily time frame
- The pair of BCH/BTC is trading at the price of 0.00024 with a decrease of -2.13% in the last 24 hours.
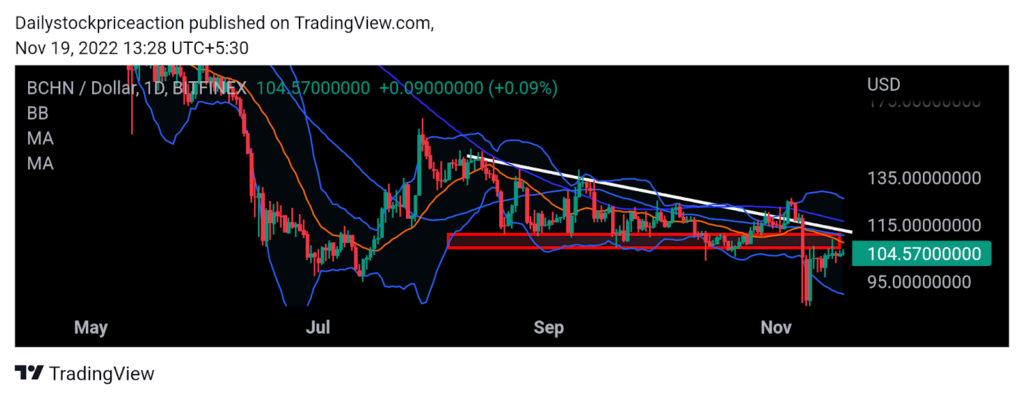
The BCH coin price, as per the price action, is stuck in a small range on a daily time frame. At present, the BCH coin price is seen hovering around the supply zone of $107 as the price bounced off the long-term term demand zone.
The coin price broke down the long-term demand zone way back and as a result, the breakdown zone is now acting as a strong supply zone. The BCH coin price is currently trading in the middle of the Bollinger band indicator as the coin price consolidates. The coin price tried to give a breakout of the supply zone but failed as it formed a strong bearish candlestick pattern at the top. To deny the fall in the
BCH coin price fell off the supply zone, bulls need to take the charge and push the price higher. Currently, the BCH coin price is trading below all the important Moving Averages. The BCH coin price tried to break out of 50 MA but failed to do so. Although the coin price has given a breakout of 20 EMA, it needs to break out of the range for a further bullish rally. Volumes have been normal despite the rallies and rejections. Investors should wait for the breakout of the small narrow range and then act accordingly.
The BCH coin price has fallen below the long-term demand zone on daily charts
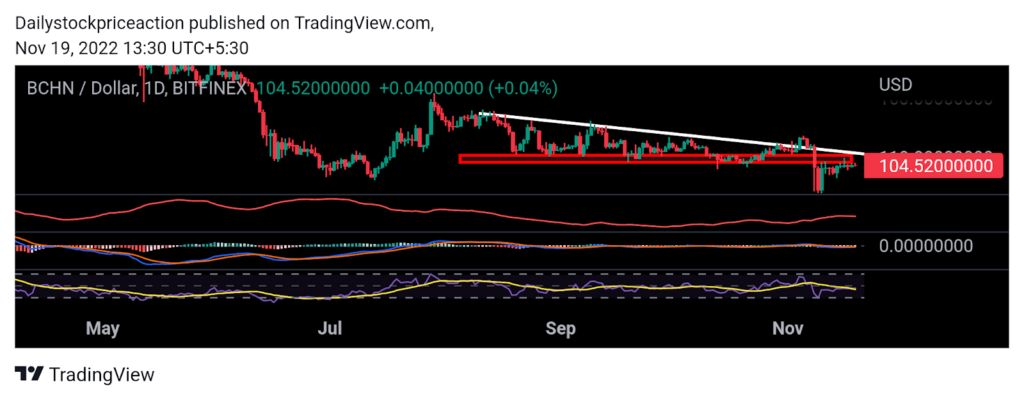
Moving Average Convergence Divergence: MACD indicator has given a positive crossover, despite the coin price falling below the important demand zone.The blue line crossed the orange line on the upside indicating a bullish momentum in the upcoming days. As the coin price consolidates, the MACD line has narrowed. Once the coin price starts moving upside the MACD lines can be seen widening supporting the trend, till then investors should be cautious.
Relative Strength Index: RSI curve has crossed the 20 EMA line after the time. Gave a breakout of the supply zone. Despite the breakout, the RSI curve is yet to cross the halfway mark of 50. Once the coin price starts mining up again with strong bull support, the RSI can be seen crossing the 50 halfway mark. This would validate the bullish momentum. At present, the RSI curve is trading at 43.78.
Average Directional Movement Index: ADX curve has slipped below 20 as the coin saw a heavy sell-off during the last 6 months. As of now, the ADX curve is still downward sloping. Moving forward for the BCH coin price to come out of the bearish zone the ADX curve needs to start moving in an upwards trajectory. At present, the ADX curve has turned sideways indicating a halt in the Price of the BCH coin. As seen on the charts the coin price has started consolidating at the bottom forming bullish candlestick patterns.
Conclusion: BCH coin price is in a strong downtrend. As of now, the coin price has started to consolidate on a daily time frame. The technical parameters suggest the same. It remains to see if the coin price will break the consolidation on the upside or downside.
Support: $5.5 and $5.3
Resistance: $7.8 and $8.2




