
 Boomer
 Covenant x402
 Claudia
 Pearl
Pearl Quantus
 Bitcoin
 NEAR Protocol
- ARB token shows bullish indications on the charts.
- Bulls succeeded in attaining strength and holding the gains.
Arbitrum token price is floated in the bullish territory and surpassed the 20-day EMA, signaling buyers strength on the charts. Moreover, the price action favors bulls who are showing their dominance and maintaining their stability. Last session, Arbitrum gained a bull move and rose with a massive spike of 8.50% showing huge buyers accumulation and activation of muscles.
The bullish incremental move of more than 8% on the intraday session shows that a short covering move was noted, which signals that short sellers are trapped and a long buildup from buyers has started.
Moreover, a trendline was broken out, which signals a breakout of resistance. The token is ready to retest the highs near $1.800, which buyers will prepare to crack.
When writing, the ARB token trades at $1.24 with a massive intraday gain of 8.07% showing bullish indications. Moreover, the pair of ARB/BTC is at 0.0000457 BTC, and the intraday trading volume increased by 18.70% to $485.66 million. The day high of ARB is $1.253, and the day low is $1.141The market cap of ARB is $1.58 Billion.
Will ARB be ready to retest its 52 week highs?
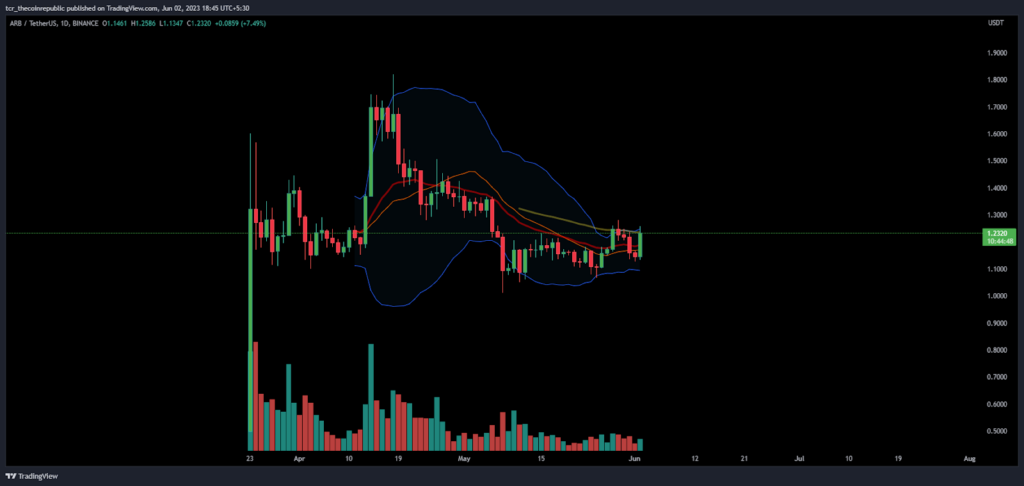
On the daily charts, the ARB token trades near the 100-day EMA and faces resistance on the mark. Meanwhile, the token shows a massive accumulation with a volume surge, but soon sellers will have the advantage of resistance and will force it back. The price action favours the giant bulls who have the authority to raise the token, and sellers continue to struggle.
Moreover, the price is trading on the verge of the upper Bollinger band, and if follow-on buying comes in the next session, then further buying will lead to a breakout, and the trajectory of the token will head toward the next resistance mark of $1.500 soon.
What Traditional Indicators Say?
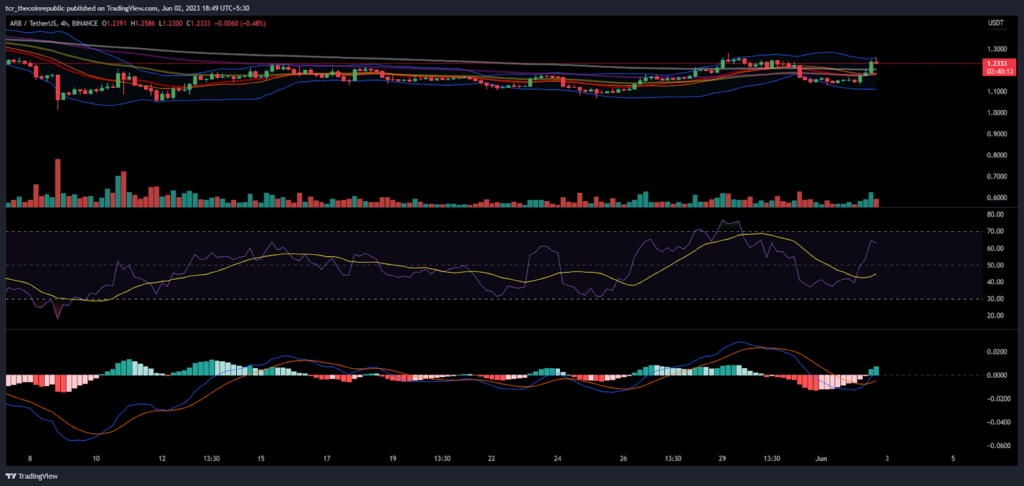
On the 4 hours chart, the ARB token has sharp bullish signs on the short-term charts. The RSI sharply rose towards the overbought zone, and the positive divergence of the index led to the buying of the token price.
Moreover, the MACD indicator conveying the same as RSI signals a bullish crossover with buyers-centric conviction. The green bars are floated on the indicator showing bullishness.
Conclusion:
ARB token continues to surge, and bulls show their muscular moves in front of the sellers.
Technical Levels:
Support Levels: $1.00
Resistance Levels:$1.60
Disclaimer
The views and opinions stated by the author, or any people named in this article, are for informational purposes only and do not establish financial, investment, or other advice. Investing in or trading crypto assets comes with a risk of financial loss.




