
 Quack AI
 Pudgy Penguins
 Injective
 Solana
 NEAR Protocol
 Canton
 Zcash
Zcash
- OKB Price Prediction stays bullish and suggests a rise in the long term.
- The OKB crypto price drops below the 50 day EMA and struggles at the 200 day EMA.
- OKB Token Price struggles to defend the crucial support of $40.00.
OKB Price Prediction stays bullish and suggests an increase in value in the long term. However, the price is at crucial support and further sell off will turn the short term trend bearish.
OKB Token Price fell 11% in the previous week and formed a bearish pattern. It dropped below the 50 day EMA and also attempted to break the 200 day EMA. It shows that sellers have taken control on the higher levels and resistance is shifting down.
OKB Price performed very well in the beginning of 2023 and showed a massive rally of 126%. It hit a swing high at $58.00 and created a hope for further rally. But sellers came forward and displayed a bearish rejection candle. Later, prices witnessed minor correction and returned back to $40 level.
At the mid of March, OKB Price succeeded to defend the support and showed a sharp rise. However, the previous high turned out as a hurdle and price again reverted in a downward direction.
OKB Price is trading at $40.52 with an intraday rise of 1.40%. The 24 hour volume to market is 0.16%. The pair of OKB/BTC is trading at 0.0015896 with an intraday rise of 1.89%. The price pattern is quite similar to the USDT pair and correlation between OKB and BTC is 0.62.
Will OKB Price bounce back or slip below $40.00?
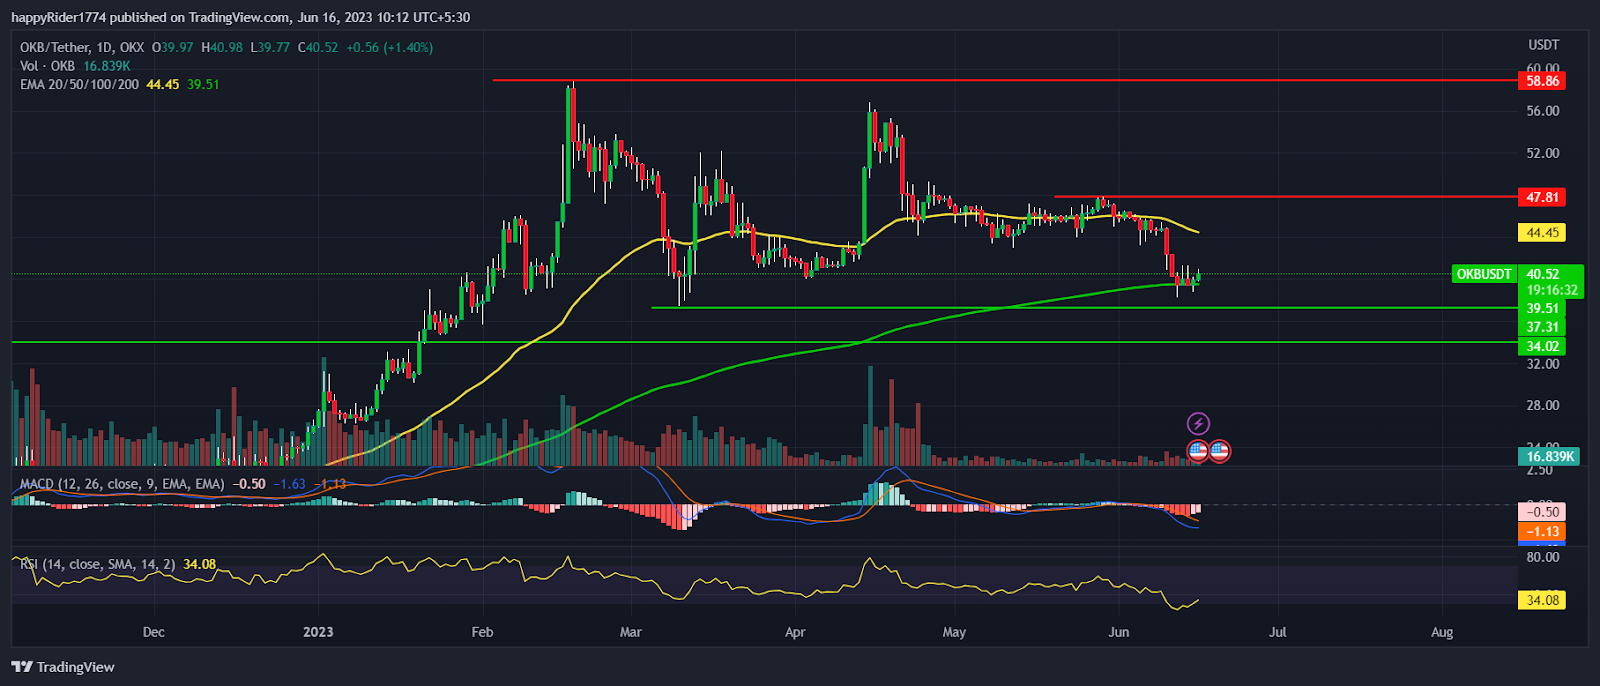
OKB Price seems to be getting stuck into the wide range between $40.00 to $58.00. Buyers tried twice to break the range with a strong buying volume but it got rejected indicating the bear dominance on higher levels.
Therefore, until the higher range is broken the token is expected to consolidate in range. However, if the price drops below $40.00 and $34.00 then it may invite a sharp decline.
Till price sustains above $34.00 the downside in OKB token seems limited. If buyers succeed to defend $40.00 then it might journey toward $47.00. To gain positive momentum buyers need to take out the $47.00 else it will trade with mild bearishness.
Buyers are active in OKB token near support
OKB Price forming a bullish hammer candle on a weekly time frame. It shows that buyers are getting active and trying their best to rebound.
The overall market sentiment might also impact the direction of OKB for the short term. So, If BTC Price recovers then OKB crypto might also take U-turn from support.
The MACD curve slopes down after displaying the negative crossover indicates mild bearishness. The RSI at 34 reversing upwards from oversold territory denotes mild recovery is possible.
Conclusion
OKB Price Prediction stays bullish and suggests an increase in prices in the long term. However, in the short term the price seems mildly bearish and buyers struggle to defend the $40.00 support.
The technical analysis suggests, Till OKB token sustains above $34.00 the possibility of rebound is high.
Technical levels
Resistance levels: $47.00 and $58.00
Support levels: $37.00 and $34.00
Disclaimer
The views and opinions stated by the author, or any people named in this article, are for informational purposes only. They do not establish financial, investment, or other advice. Investing in or trading crypto assets comes with a risk of financial loss.




