
 Dacity Coin
 Quantus
 Celestia
 Bitcoin
 Pearl
Pearl Hyperliquid
 Pons
Pons
- Chia is currently trading at $ 32.02 with a rise of 1.14% in the 24 hours.
- Chia’s live market cap is $243502727.
Introduction
Chia Network (XCH) is a popular privacy-enabled and layer-1 blockchain network that has a custom programming language known as Chialisp. It also has a novel consensus mechanism called proof-of-space-and-time (POST) combines low gas fees and high throughput with guarded architecture with privacy and security. Its main aim is enterprise use.
Chia Network was first launched in 2019. The initial beta version of the CHIA was launched in 2020. Chia Network is fully functional including wallet, transactions, and smart contracts. Chia Network (XCH) was mainstreamed in Delaware in 2017. The founder of Chia coin was the same as BitTorrent, Mr. Bram Cohen.
Chia Network Network Price Analysis
EMA: Chia Price is currently trading below the 200-day EMA and 50-day EMA on the daily time frame, which is a negative sign. Investors’ sentiments regarding Chia are negative and are on the selling side because of the bad performance of Chia.
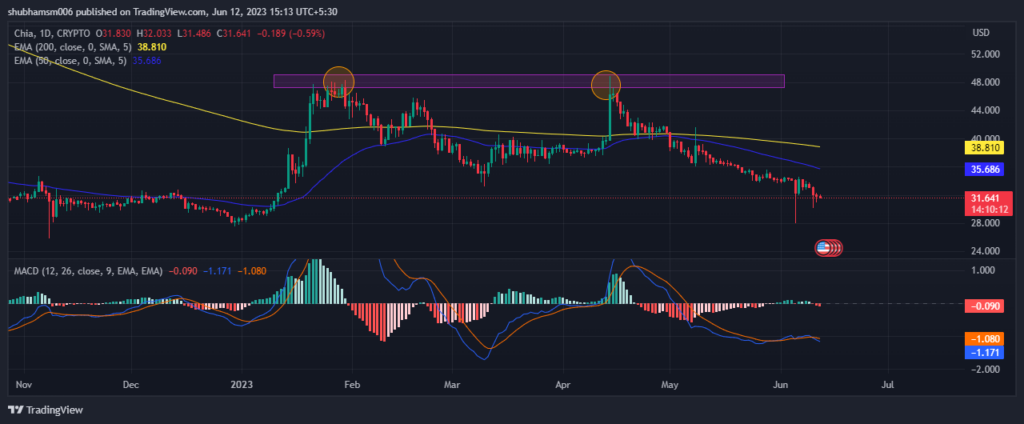
MACD: Right now, MACD is giving bearish views. The MACD line is at -0.153 and the signal line is at -0.129. Both are on the negative side and give bearish signals and are also below the zero line.
RSI: The current value of RSI is 37.74 points and the 14 SMA line is currently below the median line around 35.44 points which shows bearish sentiment in the market. RSI showing bearish sentiments among investors and traders.
Stochastic RSI: The current %d line is at 51.68 and the %k line is at 58.13 which indicates neutral zone.
Trendline Analysis:
As per the Trendline, it seems it’s respecting the Trendline. For now, it’s getting rejection from the trendline and can go downward. But in the future, it appears to be bearish. So, the price of CHIA can continue to fall and try to break the current support. f it happens, then a massive fall can be seen in the future.
Technical Levels:
Support – The current support level of Chia are $31.354 and $28.492
- Resistance –The current Resistance level of Chia are $39.326 and $44.436.
Conclusion
According to the analysis, the indicators indicate a bearish signal. The price is under the control of bears, and it is expected to fall more in the near future.
Chia’s price shows a pessimistic scenario currently. Major reliable indicators like EMA, RSI, and MACD are giving negative signals about the Chia coin. Investors are also not showing any big buying interest and this could be happening because of the consistent negative performance of the coin. If the coin breaks the current level, then the chances of the coin falling further may also increase.
Disclaimer
The analysis given above is for informational and educational purposes only. You should not be taken it as financial, investment, or any other trading advice. Investing in or trading crypto assets is risky. Please consider your circumstances and risk profile before making any investment decisions.




