
 NEAR Protocol
 Bitcoin
 Puffer
 Hyperliquid
 ZKsync
 Pudgy Penguins
 Pearl
Pearl
- TRX shows a retracement in the last trading sessions.
- Bulls are facing rejection from the $0.08580.
Tron price is showing a retracement from the supply range of $0.08580 and continued to drop showing a downtrend in the last few trading sessions. Recently, TRX was shown climbing up the stairs and went towards the resistance mark of $0.08500. Afterwards, TRX is not able to sustain over the top and slowly sinking into the bottom.
The ongoing price action is showing that price is taking support on the 50 day EMA and ready to retest the 200 day EMA soon. Moreover, the price is showing bearishness in the last trading sessions and bulls are slowly slipping the gains and losing the grip.The trend is shifting towards the bears and sellers showed their presence in the form of bearish candles formed on the charts which showed lower lows sequence in the last trading sessions, breaking the following support marks.
When writing, the TRX coin trades at $0.0673 with an intraday drop of 1.27%, showing a down move. Moreover, the pair of TRX/BTC is at 0.0000026 BTC, and the intraday trading volume increased by 2.50% to $6.26 million. The day high of TRX is $0.07054, and the day low is $0.06933, showing a reversal. The market cap of TRX is $6.36 billion.
Daily Charts Structure of TRX
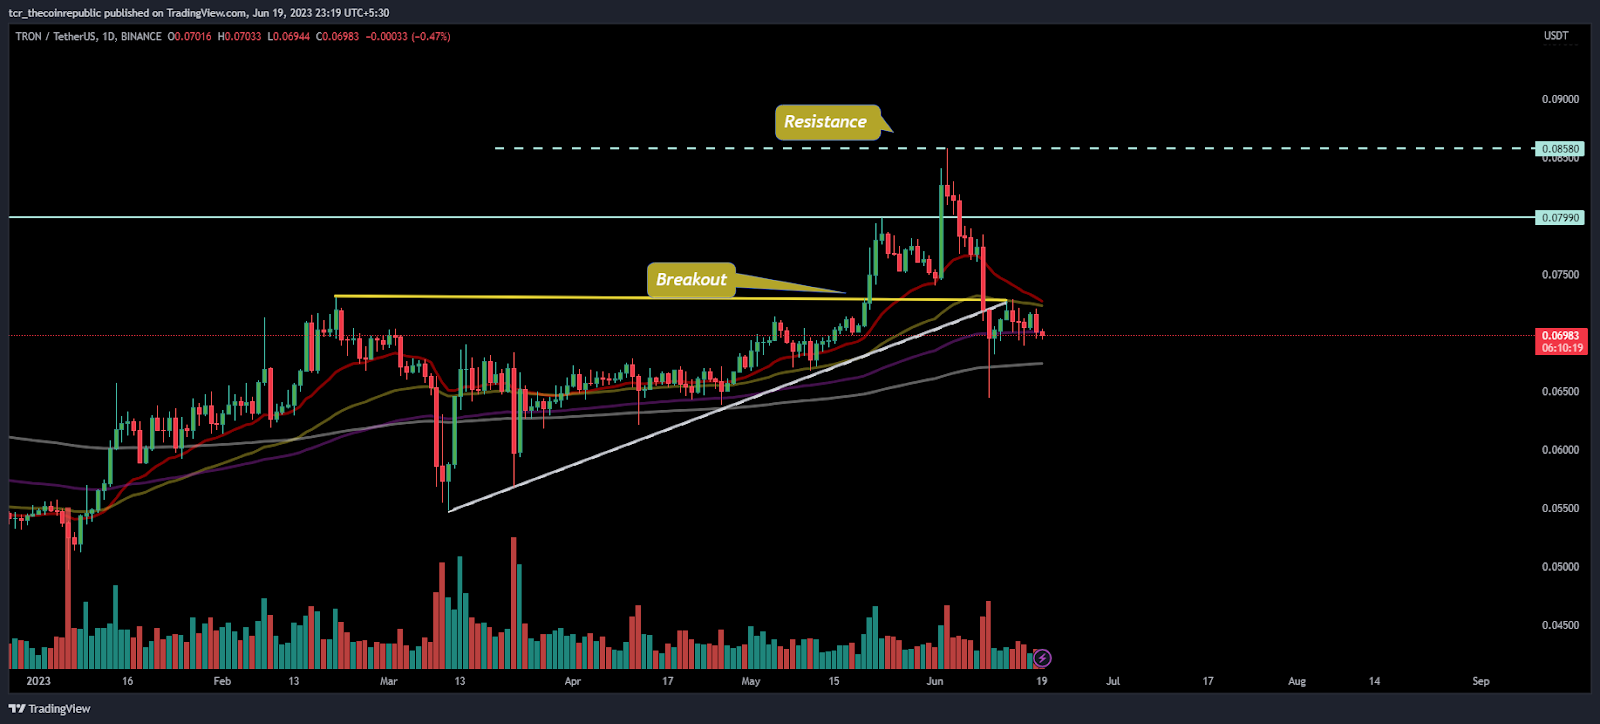
On the daily charts, TRX is forming a negative outlook and hovering near the 50 day EMA, and buyers are noted with long unwinding moves resulting in the reversal from the top.
Moreover, the price action shows that a breakdown below the lower trendline was noted and fetched a 200 day EMA and soon a wick was formed there and continued to consolidate near the 50 day EMA mark. This move shows that sellers are again trying to revisit the mark and willing to break the TRX below the 200 day EMA.
What Traditional Indicators Say?
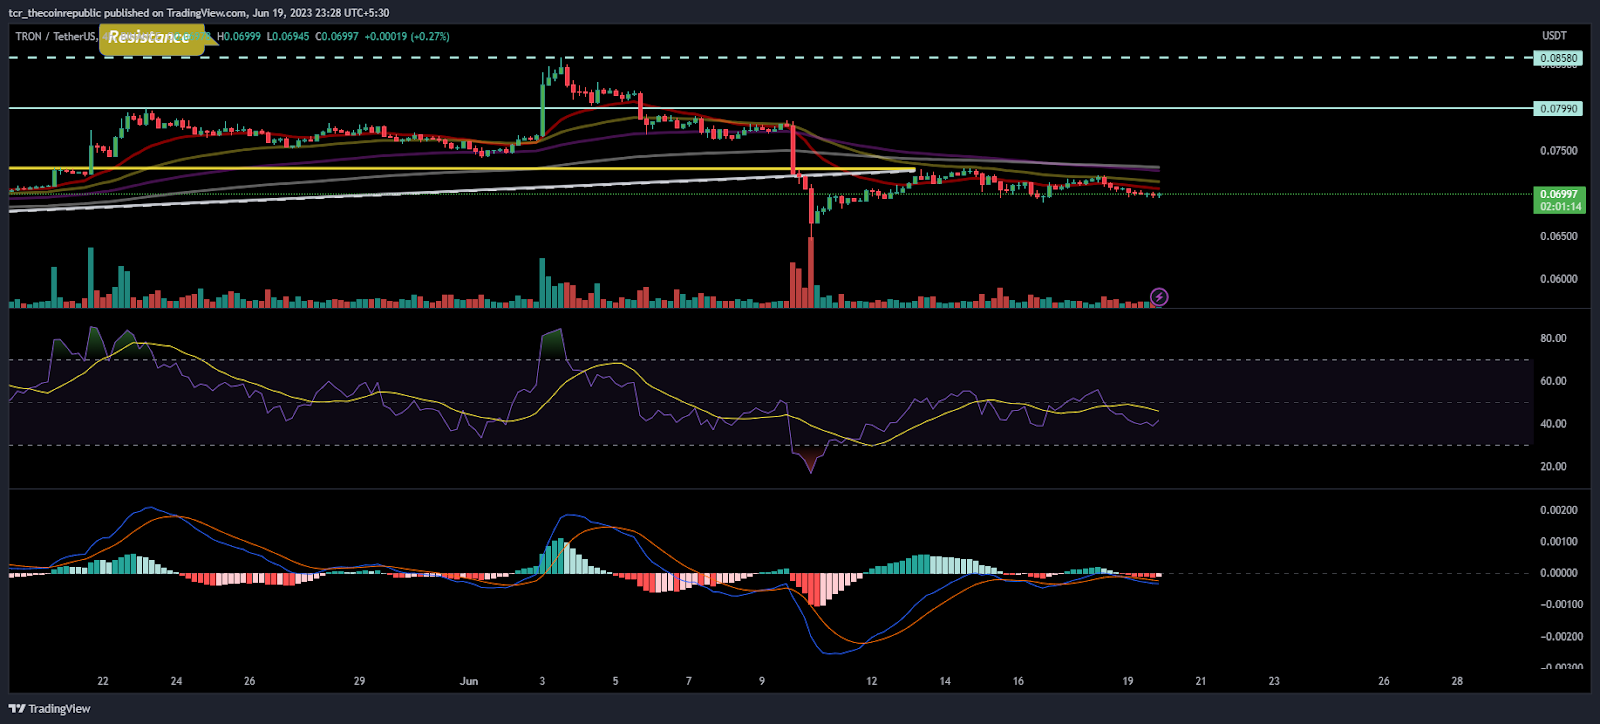
On the 4 hour charts, TRX remained in the range and soon a decisive move can be seen in the upcoming sessions. The battle is now at an exciting stage where coin is on the verge of giving a big move which could be anticipated soon.
The RSI curve is floating below neutrality and a negative crossover was noted on the charts. This move indicates that the curve is unable to escape above 50, and showing weakness on the charts.
The MACD indicator shows red bars and showing bearish crossover on the charts indicating a negative outlook. Moreover,sellers are gaining traction in the last trading sessions.
Conclusion:
Tron price is showing sellers traction and weakness on the charts which could led to a further breakdown towards 200 day EMA in the upcoming sessions.
Technical levels:
Major support: $0.06500
Major resistance: $0.08500
Disclaimer:
The views and opinions stated by the author, or any people named in this article, are for informational purposes only and do not establish financial, investment, or other advice. Investing in or trading crypto assets comes with a risk of financial loss.




