
 Boomer
 Minter
 Pearl
Pearl Pudgy Penguins
 Sui
Sui Covenant x402
 Pump.fun
- The price of MANA is trading at $0.377.
- The MANA price increased by +2.07% in the last 24 hours.
- The MANA year-to-date return is +26.63%.
Weekly Trend Analyzation
This week the trend was bullish as the price was up by 12.79%. By trend and price information history, we can say that MANA is performing well.
All-Time History Analyzation
The coin’s value plummeted by more than 73.47% in all-time history, giving not the best returns to the investors’ money.
(Technical Analysis In 1-W Timeframe)
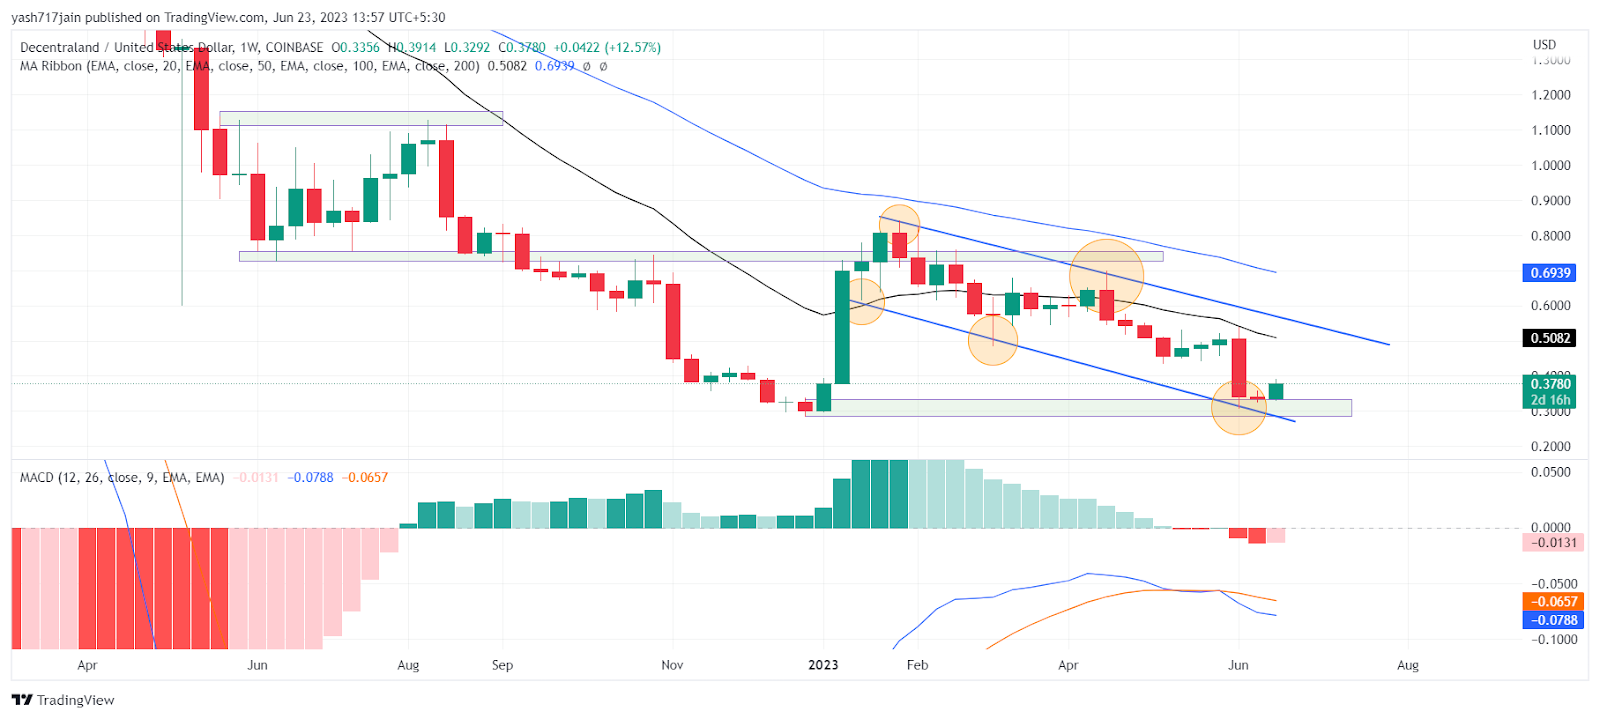
Source: MANA/USD.1D.COINBASE by TradingView
(Technical Analysis In 1-D Timeframe)
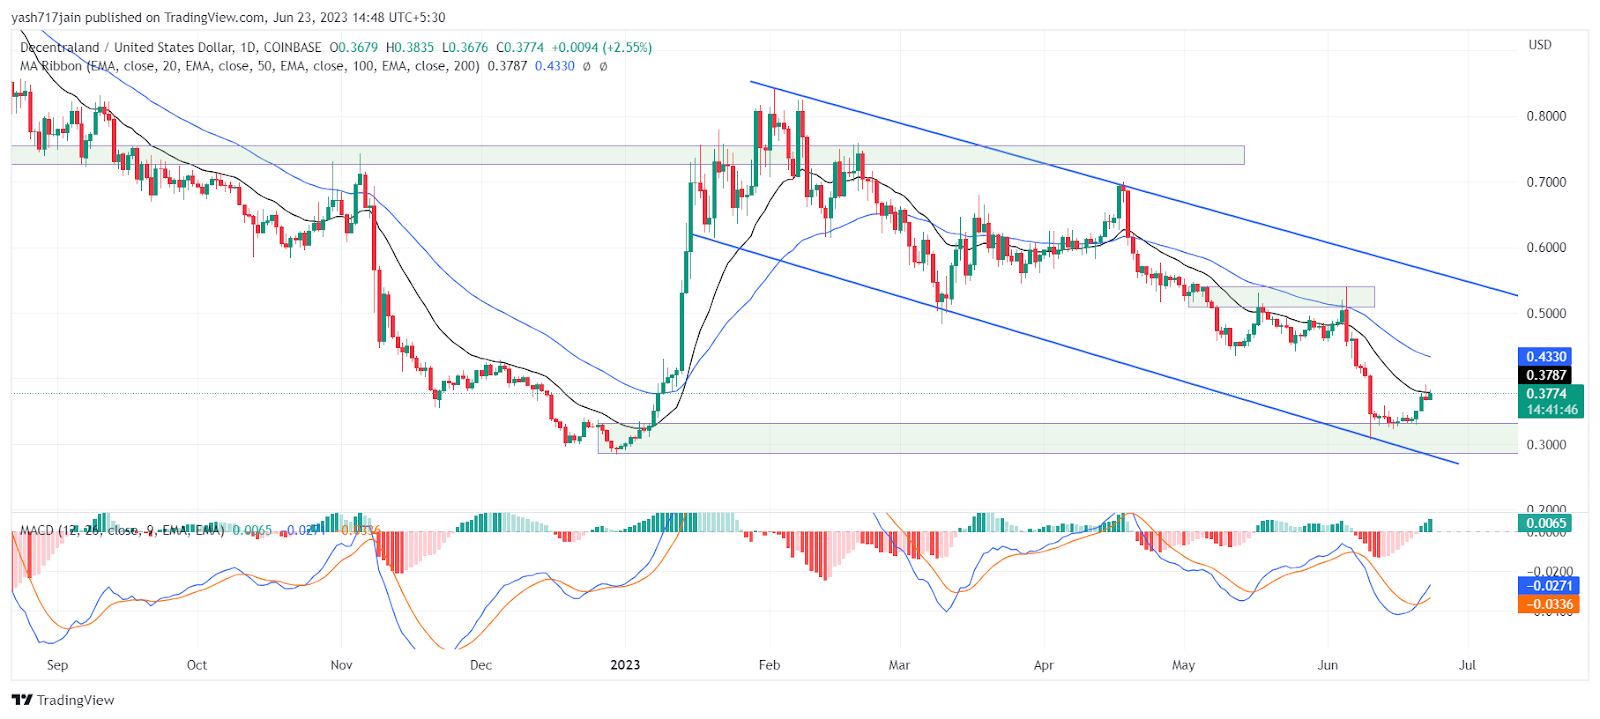
Source: MANA/USD.1D.COINBASE by TradingView
Trendline Analyzation
As per the zones created in the 1-W chart & 1-D chart, we observed that the MANA coin is moving in a pattern by making lower lows and lower highs in both the timeframe. It respected multiple support and rejection very well, taking exactly from the drawn trendline on the chart. By observing both trendlines, it can be said that it is going for a bullish flag pattern. On the day of writing, the coin has already taken support from the zone, it can be assumed that it can either break the above trendline after crossing multiple resistances in between and can give a breakout or it can retract back to the support zone. Since it is below all major EMA’s, it would retract back to the support zone. Hence, It can reach $0.305 soon which is the nearest major support.
Supertrend
With the help of just two parameters: period and multiplier, this indicator works well. At period value 20 and multiplier value 2, it shows the continuous trend if it’s bullish or bearish. As shown in the chart, it’s bearish.
MACD
As we can see in both the chart, the blue line or MACD line crossed the signal line from above while making a bearish crossover in the 1-W chart, and in the 1-D chart, the blue line or MACD line crossed the signal line from below while making a bullish crossover. This indicates a bullish signal in the short term and a bearish signal in the long term.
EMA
The price is going below on both 1-D & 1-W charts. It is below the 20 & 50 EMA (exponential moving average), which is resisting the price and giving tough levels to breach. The sellers are stronger than the buyers. To change the direction, the price has to sustain above the 20 & 50 EMA. This indicates a bearish signal in both the long term & the short term.
Bollinger Band
In the Bollinger Band indicator, MANA coin price trades at the lower band. After taking rejection from the 20-day Simple Moving Average (SMA) of the Bollinger Bands, it is indicating a more downward move in both the 1D and 1W charts.
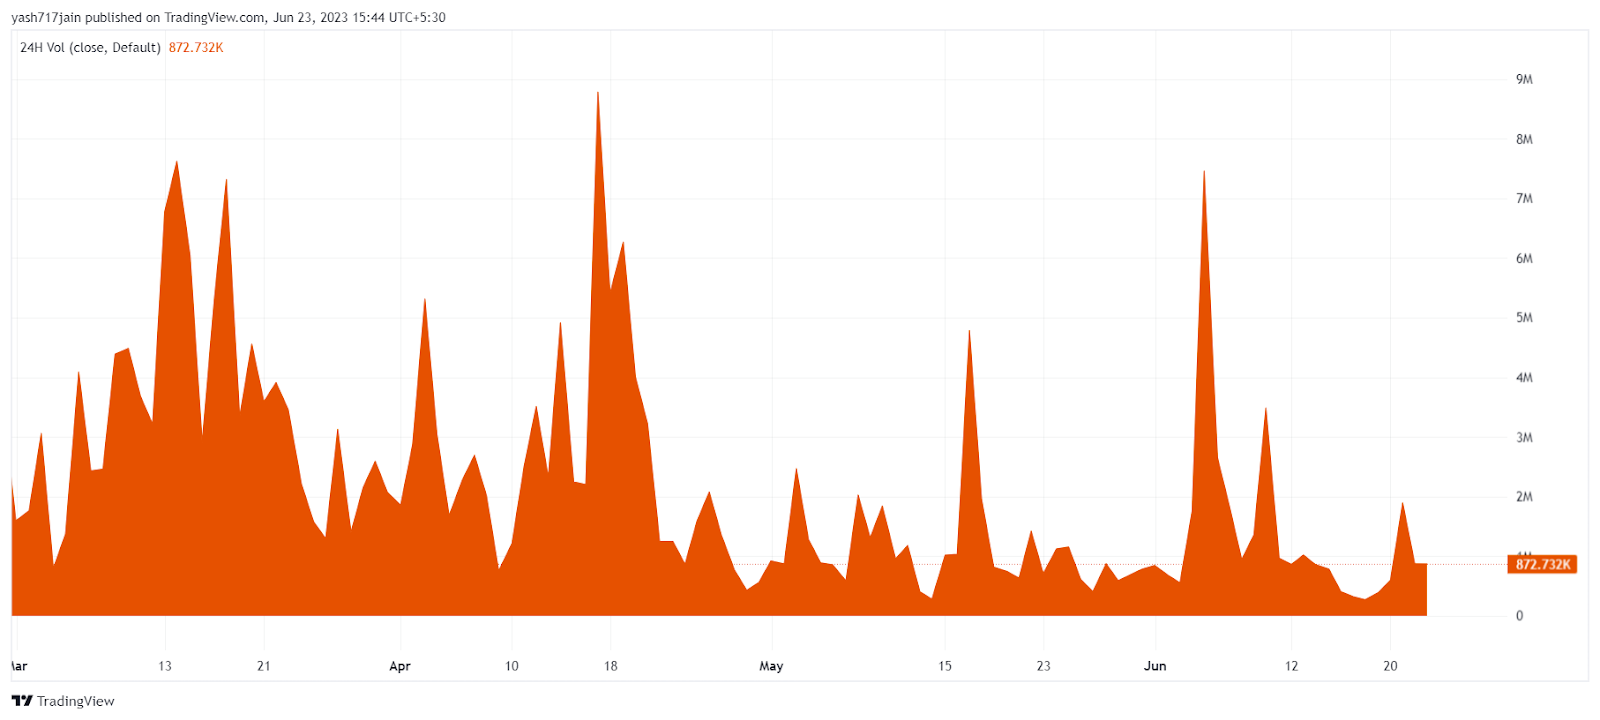
Source: MANA /USD.1D.KRAKEN by TradingView
Volume Analyzation
The amount of MANA traded in a day is $56829733. It fell by 4.69% since the past day. The trading activity is low now because the market is unfavorable and the presence of buyers for the coin decreased significantly as well. Therefore, it can not push the price up due to the lack of considerable volume present in the market.
Conclusion
On the day of writing, technical parameters, sentiments, and price action suggest that MANA coin price as per the 1D chart is bullish in the short-term and bearish in the long-term based on the 1W chart.
Technical Levels:
- The Nearest Support Zone is $0.305.
- The Nearest Resistance Zone is $0.532.
Disclaimer
In this article, the views and opinions stated by the author, or any people named are for informational purposes only, and they don’t establish investment, financial, or any other advice. Trading or investing in cryptocurrency assets comes with a risk of financial loss.




