
 Covenant x402
 Tetsuo Super Intelligence
 Doge Pepe
 Claudia
 Boomer
 Quantus
 Bitcoin
- The price of Synthetix (SNX) is trading at $2.03.
- The 24-hour volume is $18.78 Million which increased by 38.68% in 24 hours.
- Synthetix (SNX) price has been observed to increase by 2.13% in a day.
On the Ethereum network, a system for decentralized finance (DeFi) called Synthetix was created. The users have the ability to generate and trade synthetic assets which are tokenized representations of real assets like currencies, commodities, shares, and indices. Through Synthetix, users can gain access to these assets without owning the underlying assets themselves.
Trend Analysis
The trend and price information in the chart allows to determine that Synthetix (SNX) is currently in a downward momentum with lower lows. The price has turned away from the support level and is currently moving within the triangle pattern. Synthetix’s Return on Investment (ROI) has grown by 332.27%, and only lately it reached an all-time low of $0.03258.
SNX is Trading in Downwards Direction
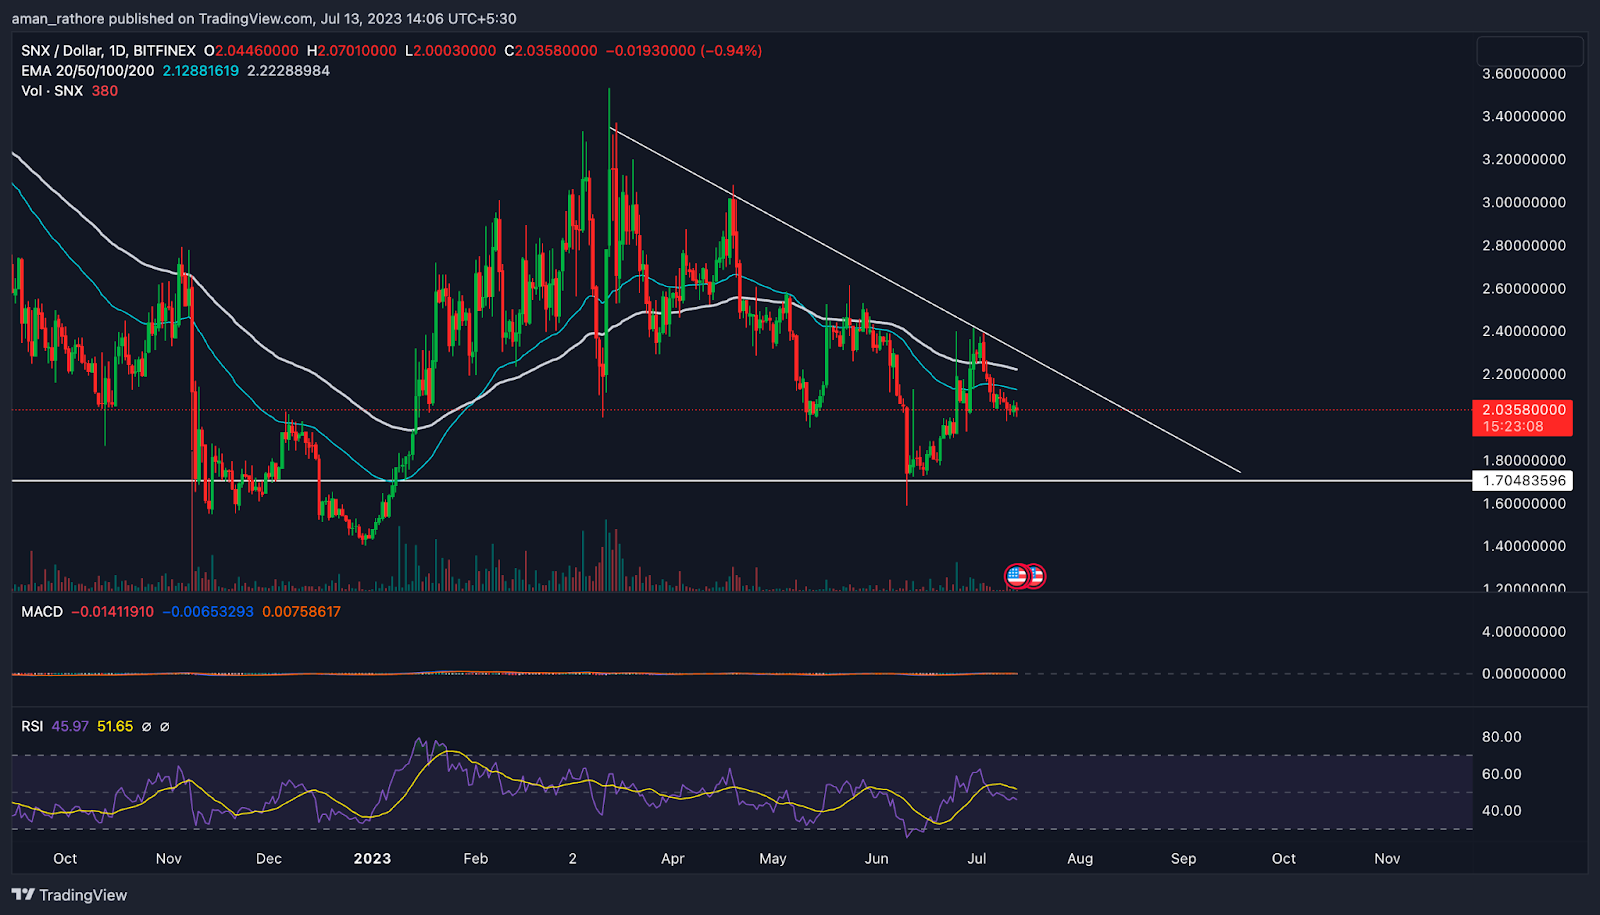
Synthetix (SNX) Price Analysis
EMA: The 20-50 EMA is being traded below the SNX price at this time. A potential short-term decline is indicated by the EMA analysis, which showed that the SNX price just fell below the 50-day EMA. It does, however, continue to be above the 200-day exponential moving average, pointing to a generally better long-term prognosis.
RSI: The day’s RSI for SNX is currently revolving around 50, showing a reasonable balance between buying and selling pressure. This demonstrates that neither the buyer nor the seller enjoys a dominant position. The SNX price is stabilizing following a prior surge or drop during what traders can view as a consolidation or indecisive phase.
MACD: SNX’s price movement reveals that the MACD line is below the signal line, which could be a bearish signal. This demonstrates that in the near term, selling pressure may be greater than buying pressure. To corroborate this signal, it is crucial to take into account additional variables and employ further analytical methods.
Trendline Analysis
According to the trendline, the price is adhering to the trendline and is turning away from the support level, indicating a possible rise up to the channel’s upper line. However, the likelihood of passing the aforesaid level is is low.
Conclusion
In conclusion, based on RSI and MACD analysis, SNX is currently in negative momentum. The RSI shows a relatively negative condition, while the MACD shows a bearish diagonal. The volume also appears to be diminishing. Based on this, it can be said that the price of Synthetix is in a downward direction and it is forming a weak market structure.
Technical Levels
- Support – The current support level of the Synthetix (SNX) coin is $1.743.
- Resistance -The current resistance level of the Synthetix (SNX) coin is $2.413.
Disclaimer
The views and opinions of the author, or anyone named in this article, are for informational purposes only. They do not offer financial, investment, or other advice. Investing or trading crypto assets involves the risk of financial loss.




