
 Quack AI
 Pearl
Pearl Solana
 NEAR Protocol
 Canton
 XRP
XRP Derive
- Chainlink Price Prediction (BITSTAMP: LINK) shows the price took support from the nearest $7 support level.
- The LINK coin price increased by 19.25% over the last 24 hours and by 31.42% over the past week.
- At press time, Chainlink is trading at $8.26, and the 52-week price range is $4.83 – $9.62.
Chainlink coin (LINK) is the governance token of Chainlink, a network of decentralized oracles that bridges smart contracts on Ethereum with off-chain data, APIs, and payments. LINK rewards node providers and protects the network. Chainlink’s goal is to facilitate hybrid smart contracts.
Chainlink (LINK) has a fully diluted valuation (FDV) of $7,986,685,754. This is the potential market cap, assuming all 1 Billion LINK tokens are circulating today. However, it may take several years for FDV to be achieved, depending on how LINK tokens are distributed over time. This data is provided by coingecko, a website that offers crypto data and information.
Chainlink crypto surged 16.35% in market value and by 476.03% in trading volume in the last 24 hours, per Coinmarketcap which is a crypto data and info website. Its market value is $4.3 Billion and its trading volume is $1.77 billion. There are 538.1 million LINK in circulation.
Chainlink (LINK) open interest is $207.04 Million, as per Coinglass, which is a crypto analysis website, it rose by 64.02% in the previous session. The long versus short ratio for 24 hours is 1.0764. The total number of short positions added in the last 24 hours is $2,626,127.186 against longs of $215,823.997.
Moreover, LINK coin showed good performance this month, as it was up by 57.50% and by 16.26% in the past six months. Also, the year-to-date return of LINK price is positive with a 45.06% incline.
Chainlink Price Technical Analysis in 1-D Timeframe
The Chainlink coin price (BITSTAMP: LINK) bounced back from a major demand zone at $4.83 and rose by about 65%, making higher highs and lows. LINK price is trading above the trendline, which acts as a support.
Moreover, on the daily chart, the coin formed a bullish pattern known as an inverted head and shoulder. This pattern indicates a possible reversal of the downtrend. The Chainlink crypto price also broke out from the $7 resistance level, which was the neckline of the pattern. If the price holds this level, it could continue to rise and reach the first and second targets of $8.85 and $9.47 respectively.
However, if the Chainlink coin price rejects this CMP level and falls, it could reach the nearest support levels of $6.73 and $5.98.
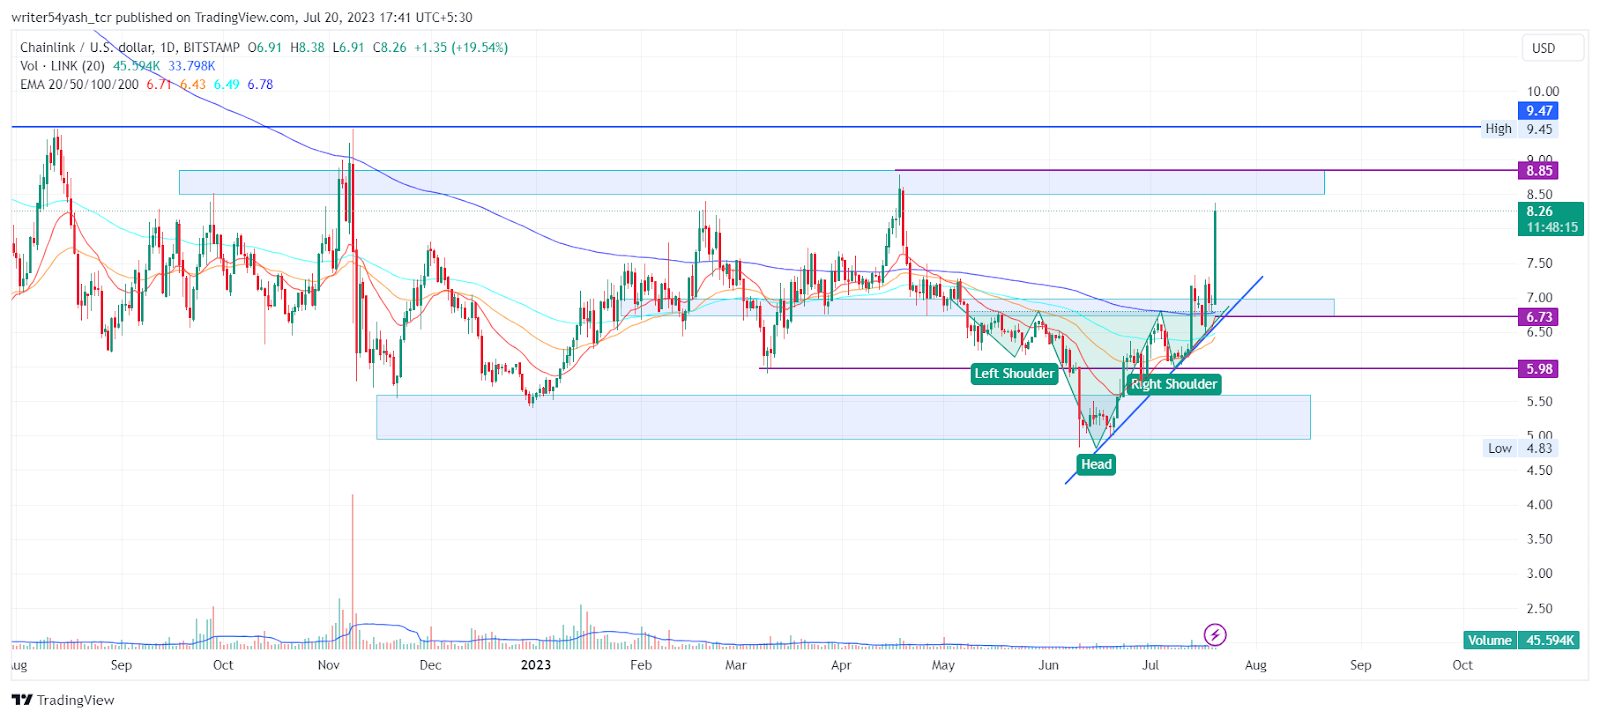
Chainlink crypto price (LINK) is above the 20, 50, 100, and 200-day EMA’s (exponential moving average). The EMA is acting as support, pushing the price trend up. Therefore, Chainlink Price Prediction suggests that the coin price could spike if the buyers accumulate more.
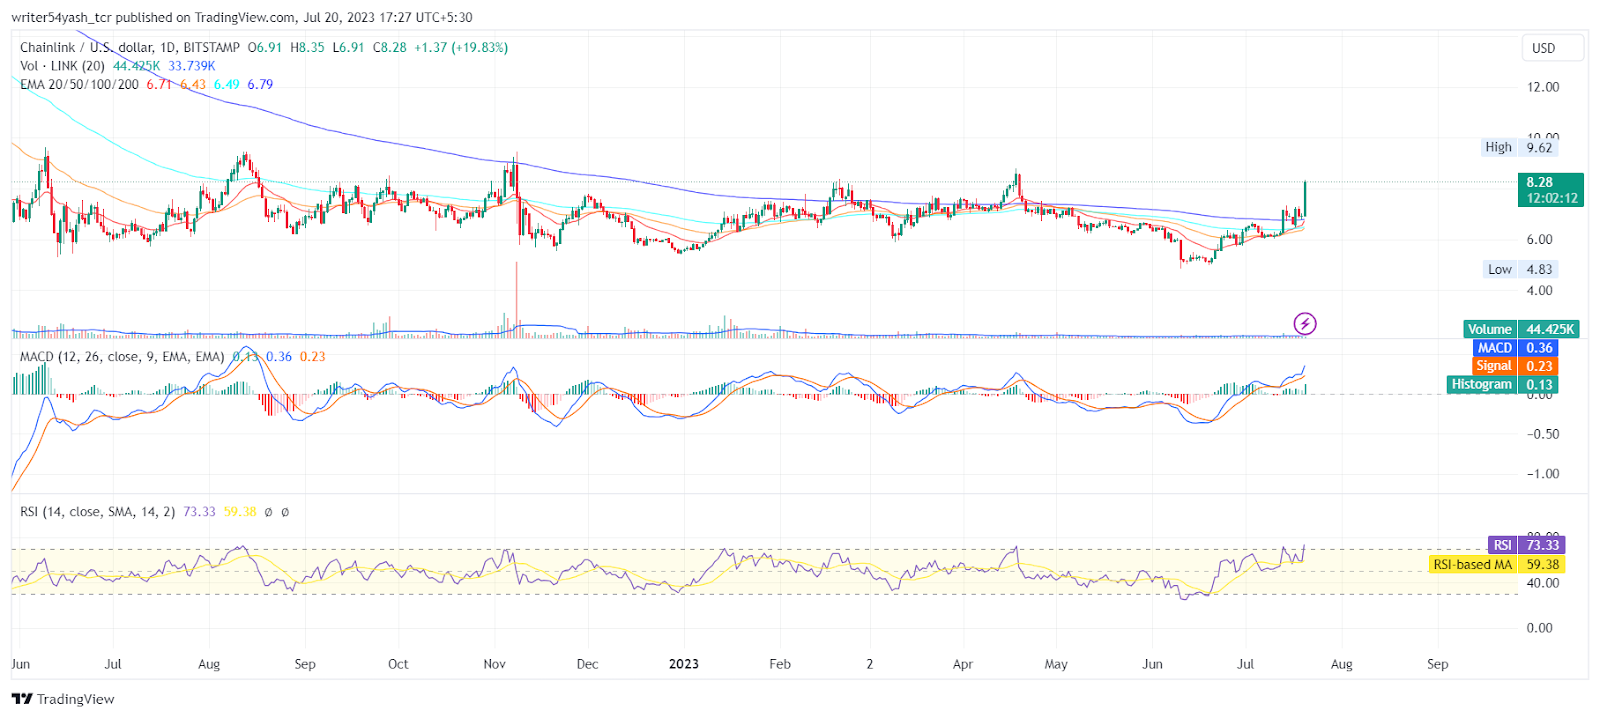
The MACD line at 0.36 and the signal line at 0.23 are above the zero
line and a bullish crossover is observed in the MACD oscillator. The current value of RSI is 73.79 points, and the 14 SMA is at 59.41 points, the RSI line took support and headed for the overbought zone. Hence, the Chainlink Price Prediction suggests the coin price is bullish.
Conclusion
LINK coin chart shows investors are bullish regarding the coin on the 1-D time frame. The price action shows a bullish outlook at the time of publishing. Technical parameters of Chainlink coin price (BITSTAMP: LINK) also support the bullish trend. The major indicators are giving positive signals and imply that the uptrend may continue. Hence, as per Chainlink Price Prediction, the coin is bullish.
Technical Levels
- The nearest support: $6.73 and $5.98.
- The nearest resistance: $8.85 and $9.47.
Disclaimer
In this article, the views and opinions stated by the author or any people named are for informational purposes only, and they don’t establish the investment, financial, or any other advice. Trading or investing in cryptocurrency assets comes with a risk of financial loss.




