
 Quack AI
 Bitcoin
 Lighter
 Injective
 Pearl
Pearl Zcash
Zcash Sui
Sui
- RUNE price prediction suggests RUNE price is taking a correction at present.
- On the daily chart, RUNE price is down by 4.63% in the last 7 days.
The Rune price prediction suggests that the RUNE price is presently trading within a descending channel. The price is facing critical resistance from the crucial 20, 50, 100, and 200 EMA levels. There is a decline in the buying and selling activity among buyers because of which no substantial moment has been observed for the past few days. The price is showing short movements and as each candle is a daily candle it might prove to be a little discouraging for short-term investors.
The RUNE price is taking a correction at present and if the price remains bearish, it can see a decline of 13 to 44% which will provide a rather nifty target for the interested short sellers. The volume sticks have declined slightly compared to the last few months. The technical indicators are moving in the favor of bears.
RUNE’s price is currently trading at $0.94 with an 11% fall in the 24-hour trading volume and has a market cap of $316.68 Million.
Investors Showing A Surge In Bearish Pessimism
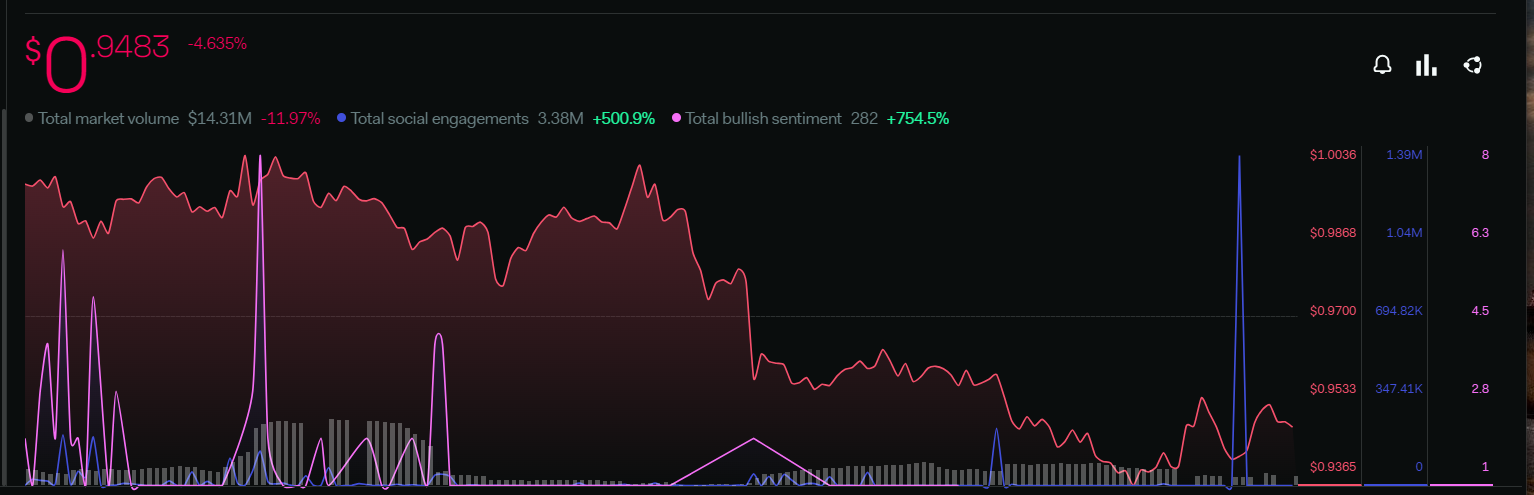
According to LunarCrush, there is a rise in the social engagement levels of the community and the bullish sentiment level is on the rise. The total bullish sentiment parameter is up by 754.45% whereas the total social engagement metrics are seeing a rise of 500.9% within the past week.
However, 24-hour trading volume has declined by 11.95%, indicating a fall in activity among buyers and sellers regarding RUNE within the last few weeks.
RUNE Price Prediction: Technical Analysis of RUNE Price On Daily Chart
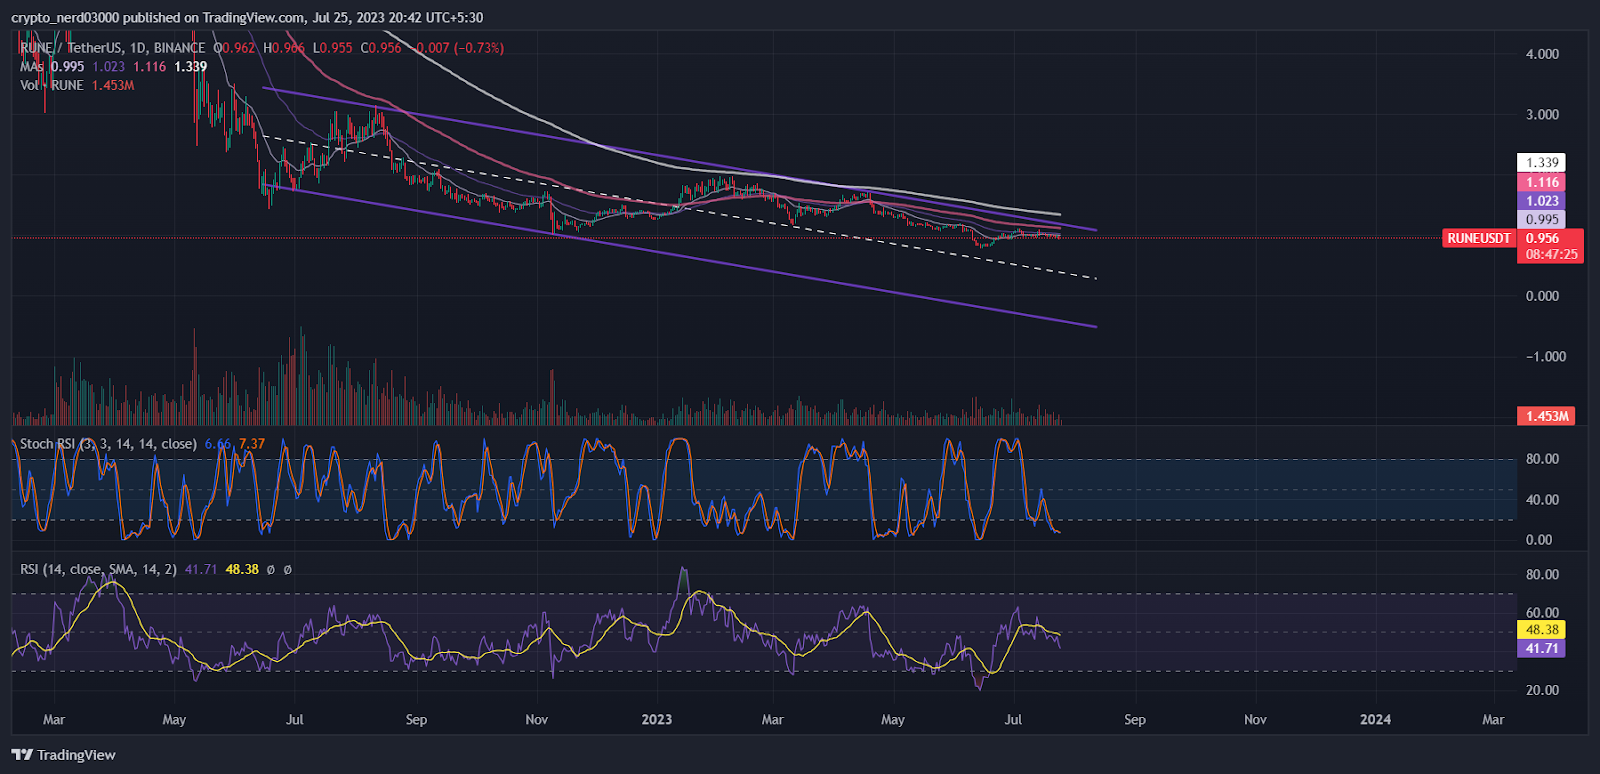
The RSI line is about to reach the oversold level on the 1-day chart after intercepting the median line. The RSI line is moving near 41.71 points and the 14 SMA provides resistance at around 48.48 points. The RSI line indicates that the price of the RUNE token may soon see a bearish decline.
Stochastic RSI is moving near the oversold levels. The Investors might wait for a positive interception between the %D and %K lines. The present value of stochastic RSI is 6.66 points.
Conclusion
According to the analysis, If the price continues to take a bearish plunge, it can see a decline of 13 to 44% which will provide a rather nifty target. There is a decline in the buying and selling activity because of which no substantial moment has been observed for the past few days.
Technical levels
Support – $0.10
Resistance – $1.33
Disclaimer
The views and opinions stated by the author, or any people named in this article, are for informational purposes only, and they do not establish financial, investment, or other advice. Investing in or trading crypto assets comes with a risk of financial loss.




