
 IGNITION
 streamoors
 Injective
 NEAR Protocol
 Starknet
 Quantus
 Bittensor
- The price of the LUNA token has declined by -26.00% in the last 30 days.
- LUNA is following a downtrend consistently declining from higher levels.
Terra is a layer 1 crypto and it provides services like payments and smart contract platforms. As per Coingecko, the community is bearish on crypto as more than 50 traders are feeling negative about crypto.
LUNA’s derivatives open interest has declined by -3.05% in the last 24 hours. It followed a decline of -56.65% in the derivative trading volume. It represents the lack of interest of traders in Terra’s native cryptocurrency. The long/short ratio of the LUNA coin is 0.8464 and the long liquidation is $18.68K. It is much higher than the short liquidation in the last 24 hours.
The market cap of the crypto is 370.477 Million USD and a fully diluted market cap is 436.186 Million USD. The circulating supply of the token is 5.806T LUNA and has a total supply of 6.837T. The all-time high for crypto was recorded on May 28, 2022, and the crypto hit a price of $18.87.
The Terra Token Technical Analysis in a Daily Time Frame
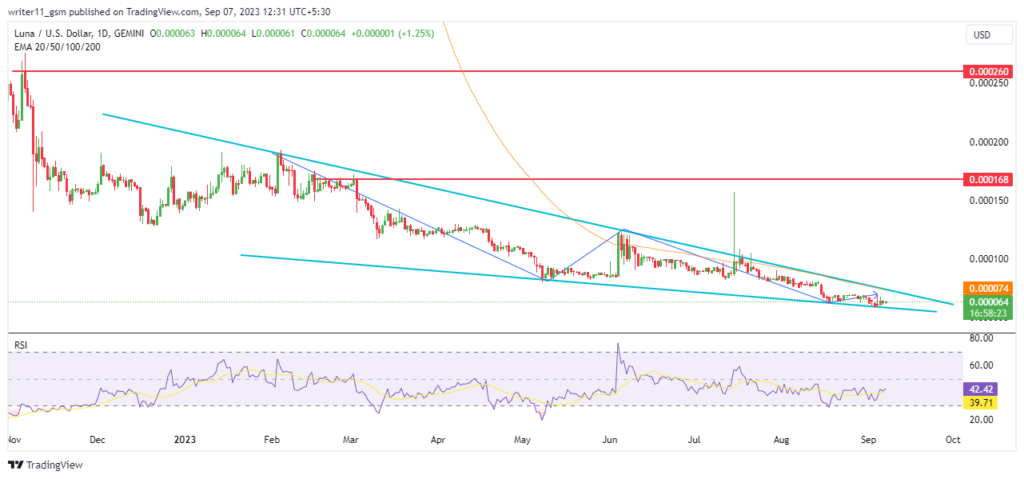
This cryptocurrency’s price has been consistently declining from higher levels. It led to the formation of the falling wedge pattern. The price can decline further if it breaks below the pattern as the price structure of the crypto is negative.
Due to highly negative price action and decline in price, the market is totally weak and negative as per the EMA analysis. The crypto asset is trading below the 50-day and the 200-day Exponential Moving Average. The 200-day EMA is far away from the price in the daily timeframe.
The RSI value is trading below the 50 level consistently and sustaining below the same level, trading in a small range. It represents an exhausted momentum in the cryptocurrency.
Technicals Summary

Based on the technical overview tool of Tradingview we can observe that the oscillators are indicating a buy signal. The EMAs are bearish, concluding that we can predict the market direction to be bearish. Very few oscillators are bullish as compared to the number of EMA’s.
Conclusion
The price of Terra coin is still within the falling wedge pattern. The larger timeframe shows a downtrend. The RSI and the EMA indicators are also bearish, which means that the price could drop more. Until then, the price might fluctuate or rise slightly.
Technical Levels:
- The support levels for Uniswap Crypto are $0.000060 and $0.000010
- The resistance levels for the Uniswap Crypto are $0.000168 and $0.00260
Disclaimer
The views and opinions stated by the author, or any people named in this article, are for informational purposes only, and they do not establish financial, investment, or other advice. Investing in or trading crypto or stock comes with a risk of financial loss.




