
 Dacity Coin
 streamoors
 astronaut
 Injective
 Celestia
 Pudgy Penguins
 Sui
Sui
- The CROUSDT price is trading at $0.0529
- The coin price is trading inside a parallel channel.
- The coin has been trading with $11,630,723 volume in the last 24 hours.
Crosnos (CROUSDT) Coin: Technical Analysis
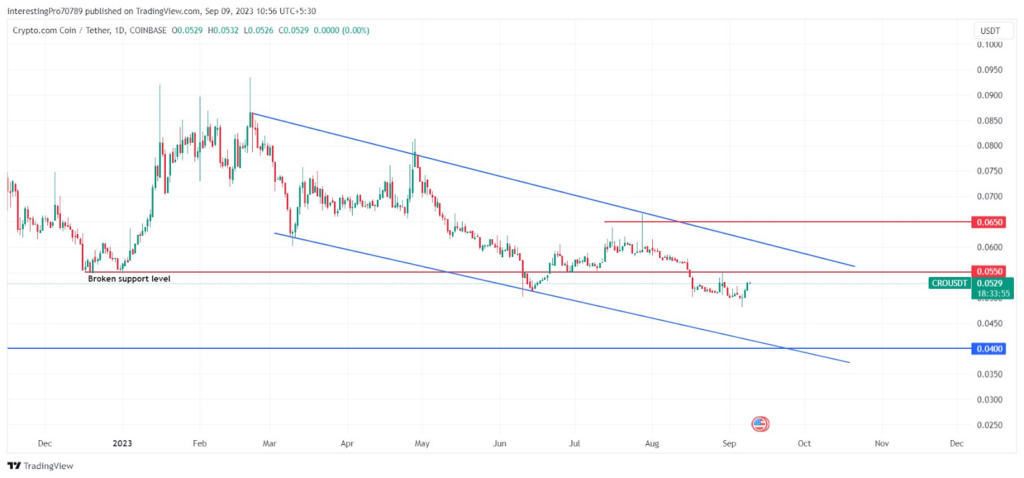
Around December 2022, the Cronos coin formed support at $0.0550 and commenced a bullish rally to $0.0935, making it the 2023-year high. After reaching $0.0953, the price faced rejection from there. The price started falling and fell to $00.0630. After it reached $0.0630, the buyers came and pushed the price in the upward direction.
In March 2023, the price went up to $0.0788 and faced a rejection from there which formed a trendline that was coming from above. The price started to fall and broke the $0.0550 support but took instant support of the trendline which was forming below. The price reclaimed the $0.0550 support. This movement of the price led to the formation of a falling parallel channel and it started to trade inside the parallel channel.
After reclaiming the $0.0550 support, the price commenced a bullish rally towards the upper trendline of the falling parallel channel. After reaching there, it faced rejection from the trendline and fell back to its $0.0550 support.
Recently, the price has given the breakdown of the $0.0550 support and is trading below it. If the price faces rejection and forms a strong bearish candle below the $0.0550 level, then it may fall to its next support at $0.0400. However, for the price to gain bullish momentum, it has to reclaim the $0.0550 support and sustain above it and form a base above it, after which it may rise to $0.0650.
Technical Indicators’ Prediction About the Current Trend
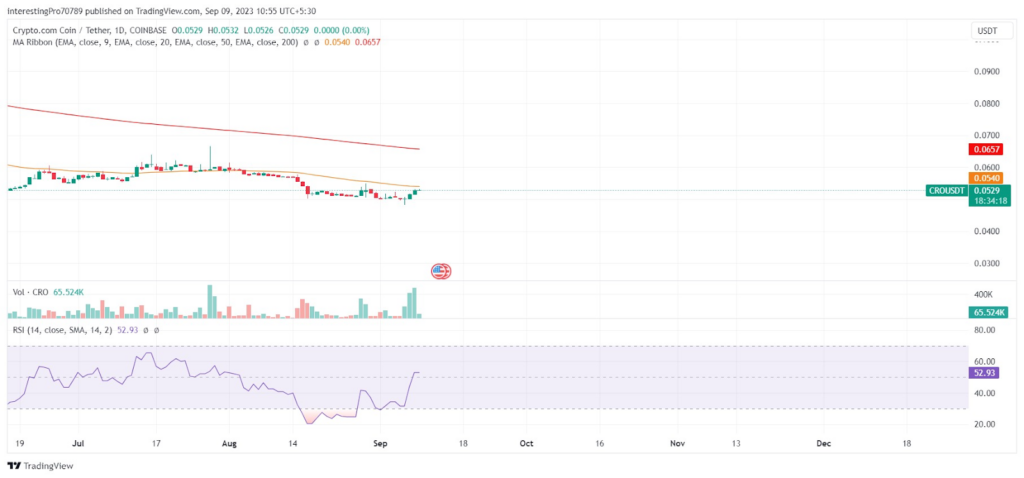
The Cronos coin is trading below the 50 and 200 EMAs, indicating that the price is experiencing bearish sentiment and is in the control of sellers.
The relative strength index (RSI) is at 57.93. The RSI line is in neutral territory, indicating that the price of Cronos is being influenced by both buyers and sellers.
The long/short ratio indicates that the short position has been placed more than the long position in the last 24 hours, where the long position is 48.57% and the short position is 51.43%.
Conclusion
The Cronos chart reflects a bearish outlook. The price has given the breakdown of the $0.0550 support. If the price faces rejection and forms a strong bearish candle below the $0.0550 level, then it may fall to its next support at $0.0400. However, for the price to gain bullish momentum, it has to reclaim the $0.0550 support and sustain and form a base above it, after which it may rise to $0.0650.
Technical levels
Resistance levels: $0.0550 and $0.0650.
Support levels: $00400.
Disclaimer
The views and opinions stated by the author, or any people named in this article, are for informational purposes only. They do not establish financial, investment, or other advice. Investing in or trading crypto assets comes with a risk of financial loss.




