
 streamoors
 IGNITION
 Injective
 Quantus
 NEAR Protocol
 Pearl
Pearl LayerZero
- APENFT is ranked #137 as per the 24h volume.
- APE has a total supply of 999.99 Trillion NFTs.
- APENFT has a market cap of $306.21 Million.
The APENFT price chart is displaying negative momentum at press time. The price of APENFT is forming a lower-low pattern. The price is creating a strong bearish pattern.
Financial Data of Ape NFT (APENFT)
On September 11, 2023, APENFT was trading at $0.00000032, which has seen a decline of 1.32%. The NFT has a fully diluted cap of $319 Million.
The trading volume of APENFT is around $196.3 Million, reflecting a decline of 3.56% in today’s market session. APENFT has a maximum supply of 999.999 Trillion NFTs and the total circulating supply is 999.999 Trillion APENFT. The volume/market cap ratio for Ape NFT is 0.04.
Notably, APENFT reached its all-time high of $0.00000764 on September 5, 2021, and it is currently trading at a price that is 95.93% lower than the all-time high.
Over the past year, the price of APENFT has seen a significant decline of 45%, suggesting that it might be following a descending triangle pattern, which could potentially lead to a break of the support level and the creation of new lower price levels.
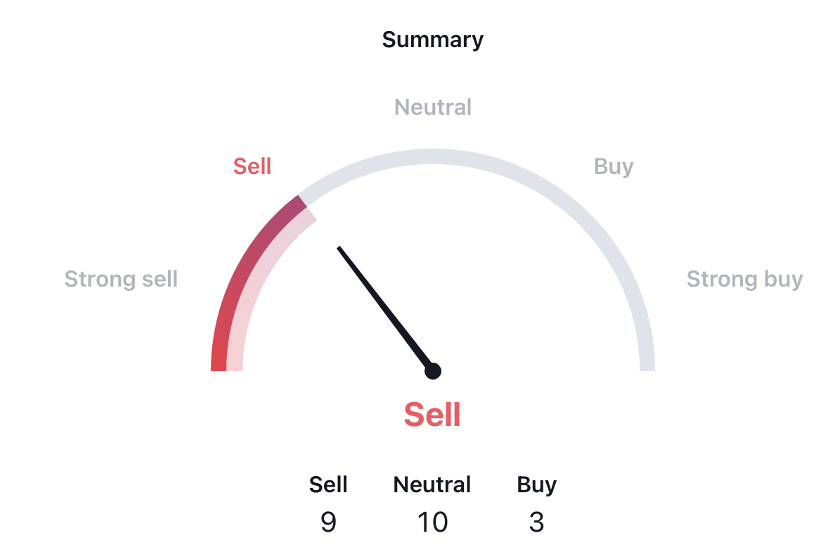
The technical summary indicator is giving negative signals for APENFT. Out of the total indicators, 9 are displaying a sell signal and only 3 are giving a buy signal.
APENFT Technical Analysis
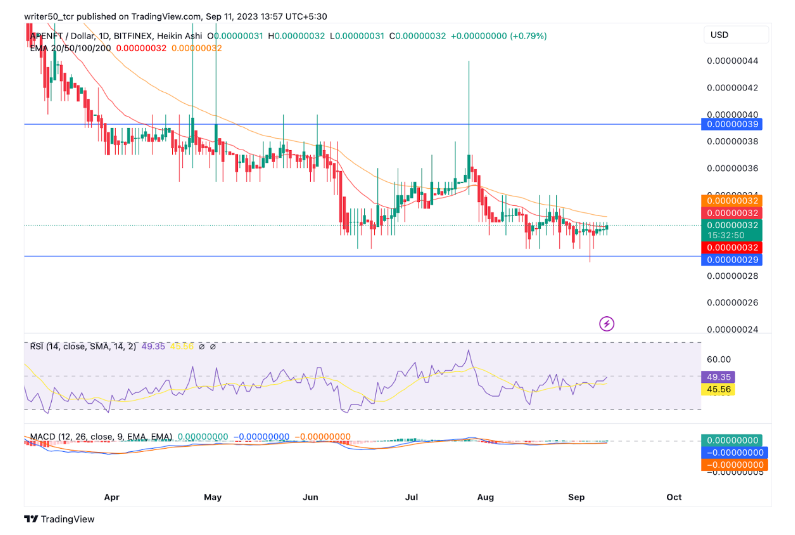
The price of APE NFT is currently trading below the 50 and 100-day EMAs. This is a negative signal and indicates that the price is likely to decline in the future.
The MACD line is below the signal line. The red histogram is also seen in the chart. This is a weak signal and the price might fall in the future.
The RSI line is near the 30 level. This is a negative zone and the price is overall negative.
Conclusion
The analysis shows that the price of APENFT is in a downtrend. The volume of APENFT is also decreasing. The price declined by almost 45% in one year. The overall structure is poor and the indicators are giving negative signals. Hence, the price is likely to fall in the future.
Technical Levels
Support Level: $0.00000029
Resistance Level: $0.00000039
Disclaimer
The views and opinions of the author, or anyone named in this article, are for informational purposes only. They do not offer financial, investment, or other advice. Investing in or trading crypto assets involves the risk of financial loss.




