
 IGNITION
 streamoors
 Injective
 NEAR Protocol
 Pearl
Pearl LayerZero
 Quantus
- The CKB token has been trading in a sideways movement for the last few weeks.
- It is currently trading at $0.00270 with a drop of 0.3% in the last 24 hours.
- The token is down from its all-time high by 93.87%.
The token has recorded losses of 49% in the last 6 months and 7.5% in the last 3 months. The losses show that the token has been in a downtrend for the last 6 months. The 2023 high of the token was $0.0070 in Feb.
Then, the price started a downtrend and the price fell to the level of $0.0026. From there the price took support and tried to move upwards, but got rejected from the $0.0033. It came down to the same level of $0.0026.
The CKB coin price is currently trading in a sideways movement from the last few weeks between the levels of $0.0026 and $0.0029. The token is trading with an increase in the trading volume by 2.42% in the last 24 hours.
The token marked its all-time high on 31st Mar 2021 when a single CKB token was priced at $0.04412. It has a current circulating supply of 42.33B CKB which is 98.52% of its total supply. The present market cap of the token is $113.97M. Its 24-hour trading volume of the token is $1.007M.
SENTIMENT ANALYSIS :
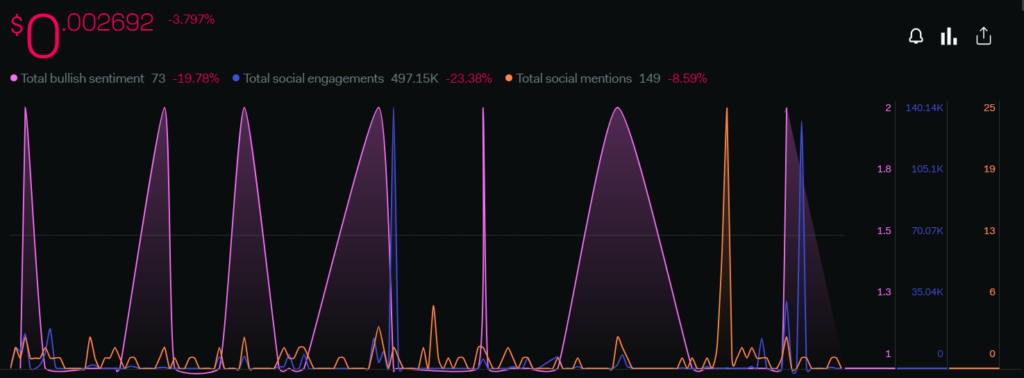
The price of the token has dropped by 3.797% in the last 1 week. Its total bullish sentiments have declined by 19.78% and the total social engagements decreased by 23.39%. The total social mentions also came down by 8.5%. The overall sentiments are indicating a bearish move in the price.

The daily sentiments of the token are showing some immense increase. The volume of the token has also increased by 20.42% and the total bullish sentiment has also surged by 83.33%. This token’s social engagements have a huge rise of 1.49k%. The daily sentiments are on the positive side and indicate a bullish move.
Technical Analysis (Daily- 1D) :
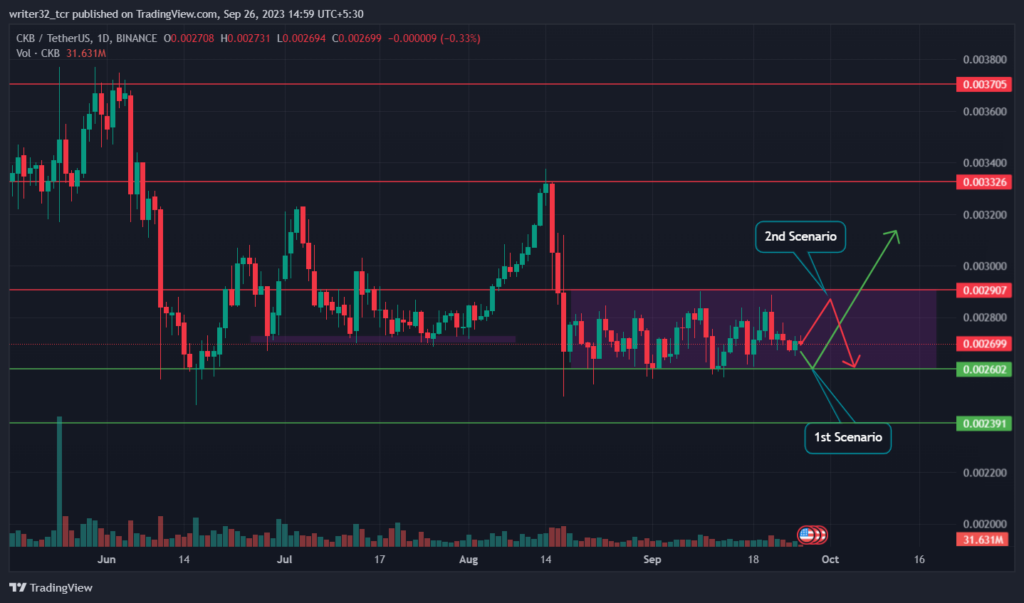
If you look at the rectangular zone, you will see that the price is moving sideways between the levels of $0.0026 and $0.0029. Firstly, the price has to break this rectangular zone to give any major price action. So, we can consider 2 scenarios :
1st Scenario – If the price where it is currently trading will move upside with a sizable amount of volume, we can easily break the rectangular zone and also the resistance of $0.0029 from where the target can be $0.0032 to $0.0033.
2nd Scenario – If the price gets rejected from the resistance level of $0.0029 and the volume gets decreased, the price will again fall to the support of $0.0026. If we break below the rectangular zone, the next support will be at $0.0024 or further if the bearish investors take over.
The price can also continue its sideways movement if some major move in the price does not happen.
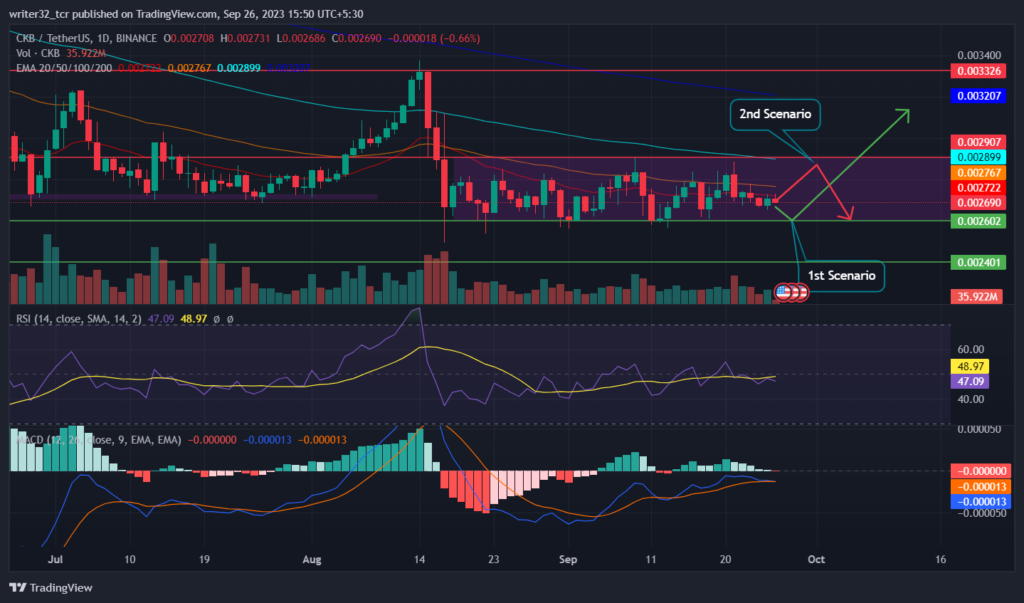
Relative Strength Index (RSI)
The RSI line is currently moving at 47.09 points and the SMA 14 line is moving at 48.97 points. It is presently moving below the SMA 14 and below the neutral level of 50, which indicates a bearish movement in the price.
Moving Average Convergence/Divergence (MACD)
In MACD, The fast blue line moving average is moving very close to the red slow line moving average. The fast blue line moving average will soon cross down from the red slow line moving average and start moving below it. The volume in the histogram is also showing a significant decrease, which also indicates a bearish move in the price.
Coin’s volume has to increase in the histogram to make a positive move in the price.
CKB LIVE CHART :
Conclusion
After the analysis, the price is not giving any major move and is moving sideways. For the price to give any major movement, it has to either break below the rectangular zone for the bearish price action. Or, the token price can break above the rectangular zone to start the bullish move.
Technical Levels
Support: $0.0026 AND $0.0024
Resistance: $0.0029, $0.0033 AND $0.0037
Disclaimer
The views and opinions stated by the author, or any people named in this article, are for informational purposes only and do not establish financial, investment, or other advice. Investing in or trading crypto assets comes with a risk of financial loss.




