
 Quack AI
 Pons
Pons Lighter
 Sui
Sui NEAR Protocol
 NeoSoul
 Quant
Quant
- The KCS token is trading at $4.59, observing a rise of 3.77% in the last 24 hours.
- The token shows a bullish signal after the price gives a breakout from the bearish trendline.
- The price is currently trading above the 50-day EMA.
The KCS token recorded a yearly high of $9.7 in the month of March. After marking the high, the price made an inverse head and shoulder pattern. It started a bearish move from there. In this move, the token lost its value by almost 60%. Post the bearish move, the token took support from the level of $3.8 to $4 and then started an upward move and gave a breakout from the bearish trendline. The price started to move under the bearish trendline from the month of July.
It marked an all-time high of $28.80 on 1st December, 2021. The token is down by 84.05% from the all-time high. During this high, the market capitalization of the token was at 2.21 Billion.
Currently, the circulating supply of the token is 96.73 Million KCS, with a market capitalization of $442.42 Million. The trading volume of the token is $914.66 thousand which has grown by 30% in the intraday session.
Sentiment Analysis
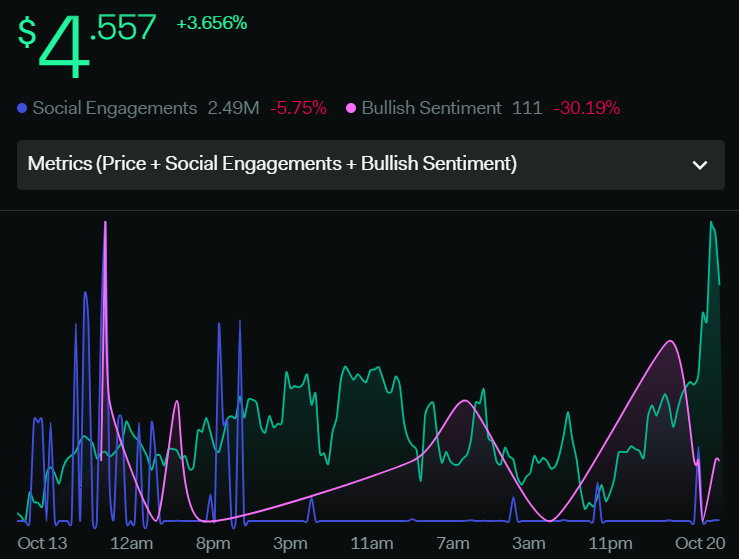
Followed by a surge of 14% in the daily trading volume in a week, The price increased by 3.6%. Social engagement metric has dropped by 5.75% showing a little bit of inactivity in the community. A Fall of 30.19% in the bullish sentiment metric will be considered negligible as the price is increasing with the surge in the daily trading volumes.
Technical Analysis Of KCS Token (Daily-1D)
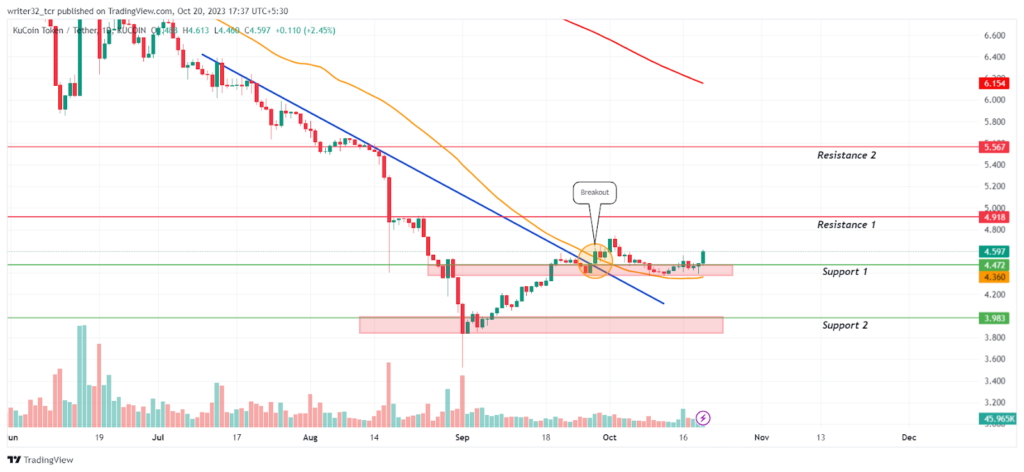
The price made a lower high after the breakout to confirm the bullishness and regained $4.4 as the support level. Presently, the price is trading above the 50-day EMA at the support level of $4.4 to $4.5.
The price can take support from this level and bounce, giving an upward move from $4.7 to $4.9. The KCS coin price may come down again to the support level from the level of $4.7.
However, If the price breaks down from $4.4 to $4.5 and gets below the 50-day EMA, it can again fall to the support level of $3.8 or $3.9.
To break the long-term downtrend of the token, the coin price has to break a major resistance level of $5.5 and move above the 200-day EMA to again get bullish.
Indicators On The Price Of KCS Token
Relative Strength Index (RSI)
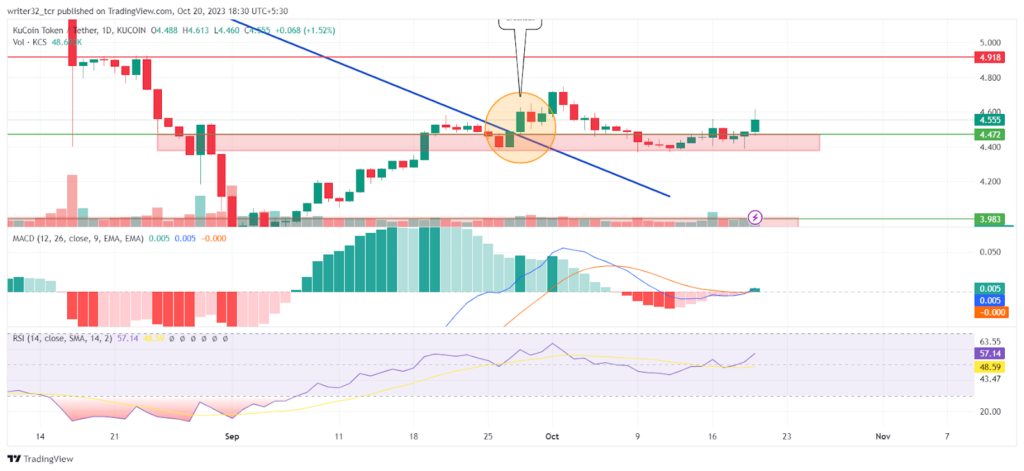
The RSI line is moving at 57.14 points and the SMA 14 at 48.59 points, the RSI is above the neutral level 50. RSI is moving above the SMA 14 which shows that bulls are in strength and there is ongoing buying activity in the market of the token.
Moving Average Convergence/Divergence (MACD)
The fast blue line moving average has just moved above the red slow line moving average, The histogram is showing some increase in the volume which is a positive sign towards an upward move. The volume may soon start to increase as the buying activity has started in the market of the token.
KCS LIVE CHART
Conclusion
The overall analysis of the KCS token indicates a bullish move in the price to $4.7 to $4.9 as the volume has started to surge and the indicators are in favor of this move. In an opposite scenario, if the price loses its support at the 50-day EMA, it will again get bearish.
Technical Levels
- Support Level: $4.4 to $4.5 and $3.8 to $3.9
- Resistance Level: $4.9 and $5.5
Disclaimer:
The views and opinions stated by the author, or any people named in this article, are for informational purposes only and do not establish financial, investment, or other advice. Investing in or trading crypto assets comes with a risk of financial loss.




