
 Minter
 Sui
Sui Pons
Pons NEAR Protocol
 Starknet
 Quack AI
 Chainlink
- The ENJ crypto has lost its value by more than 95% from all-time highs.
- The derivative trading volume of the crypto has witnessed huge advances in the last 24 hours.
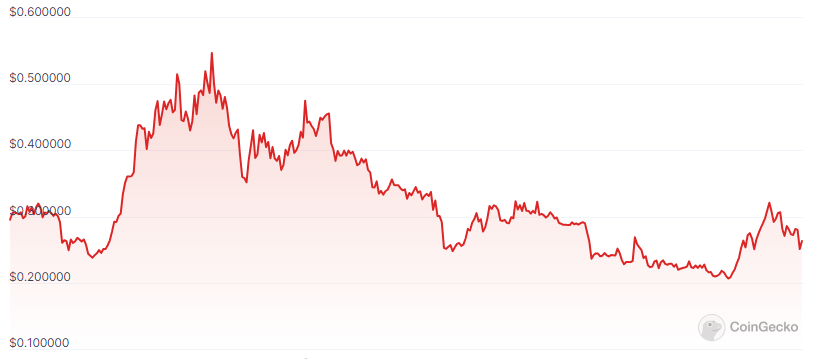
Enjin Coin (ENJ) by Enjin is an Ethereum-based cryptocurrency powering the ERC-1155 token standard for blockchain assets. The ENJ token backs asset value, ensuring transparency, scarcity, and liquidity. The Enjin Platform simplifies blockchain game development, offering SDKs and tools. Enjin, founded in 2009, has pioneered user-first blockchain products.
As per Coingecko, the market cap dominance of the ENJ crypto is 0.018% resulting in a market cap rank of #160. The volume/market cap ratio of the crypto is 0.085. Following this, the market cap of the crypto has declined by 4.62% in the last 24 hours.
Also, the spot trading volume for the Enjin Coin has advanced by 15.06%, resulting in $18.422M. This phenomenon has resulted in a ranking of 228th for the trading volume as per CoinMarketCap.
The circulating supply of the ENJ crypto is 1.0B ENJ, which is 100% of the maximum supply. It is followed by a fully diluted market cap of $267.584M. The ENJ crypto hit an all-time high of $4.85 in November 2021. Further, the crypto hit the all-time low price of $0.01562 which is 1604.87% above the all-time lows.
Activity Analysis For Enjin Crypto
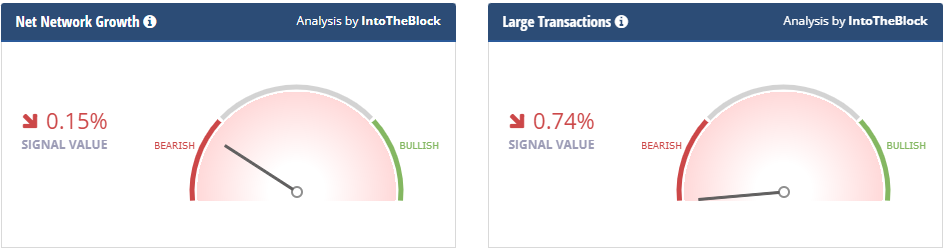
The network growth of the Enjin coin seems constant and low as per IntoTheBlock. Further, there have been no significant large transactions processed in the crypto environment. That results in a bearish signal as the signal value is just 0.74%.
Token Distribution Analysis of the Enjin Coin
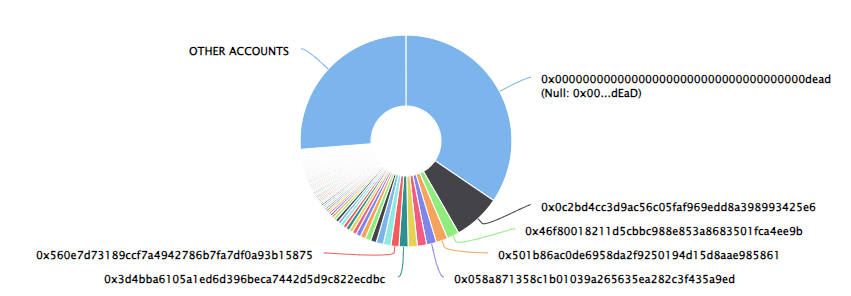
The ENJ crypto has a total supply of 1.0B ENJ tokens and there are a total of 166,430 token holders. The top 100 holders of the token own 73.75% of the total supply, which is 737.538M tokens.
ENJ Crypto Technical Analysis
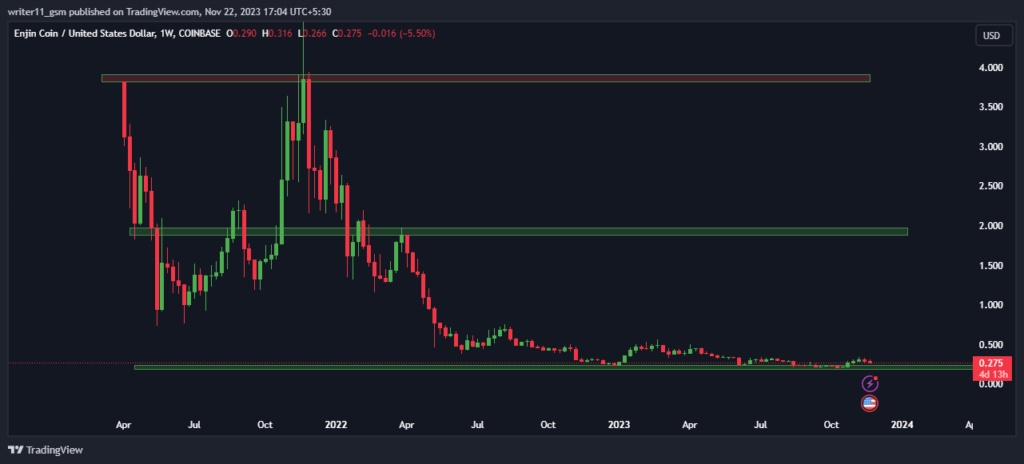
Witnessing a huge sell-off in the ENJ crypto price, it is trading at significant lows. Currently, the crypto price is forming small price range candles and it shows that the trading volume of the crypto has declined over time.
ENJ/USD Chart by TradingView
On the daily charts, indicators are giving a sell signal and showing signs of weakness. The signal line of the MACD indicator is trading above the MACD line. This behavior of the price represents that the sellers are getting into the market.
The crypto price is trading below the baseline of the Bolliger Band, which represents the current trend of the crypto to be weak.
Conclusion
The ENJ coin, ranked 160th with 0.018% dominance, faces a 4.62% market cap drop. Despite a 15.06% volume increase, the crypto hits significant lows. The network growth is low and large transactions are minimal, signaling a bearish sentiment. Technical analysis reveals a bearish trend with indicators giving sell signals and a weakening MACD. The price, trading below the Bollinger band baseline, suggests current weakness in the crypto trend.
Technical Levels
- Support levels– $0.200 and $0.250
- Resistance levels– $0.450 and $0.550
Disclaimer
The views and opinions stated by the author or any other person named in this article, are for informational purposes only and do not constitute financial, investment, or other advice. Investing in or trading crypto or stocks comes with a risk of financial loss.




